
Analysis - Consumer price indices - 3 quarter
14.10.2010
Code: q-7132-10


Consumer prices increased in Q3 2010 compared with Q2 2010 only by 0.1%. The quarter-on-quarter price level development was influenced particularly by a price growth in 'recreation and culture' together with a price drop in 'clothing and footwear'. Both of these price fluctuations were caused by seasonal influences, namely a seasonal price rise in package holidays by 11.8% and, on the other hand, discounts on summer clothing and footwear. In housing prices of natural gas went up by 4.2% since July.
The reduction of price level in food primarily came from a price drop of vegetables by 8.8%; however, prices of other kinds of food were rather growing. In 'communications' the decrease in prices of mobile phones and telephone and telefax services continued. In 'transport' the prices of automotive fuel and cars were moderately lower (-0.9% and -1.5%, respectively).
The average m-o-m growth change in Q3 2010 was -0.1%, while in Q3 2009 it made up -0.3%.
This resulted in acceleration of y-o-y price growth in Q3 2010.
Consumer price indices
previous quarter =100
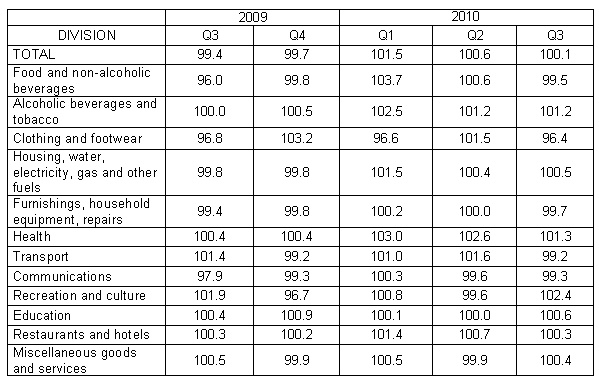
In Q3 2010 compared to Q3 2009 consumer prices raised by 1.9 %, y-o-y, which is by 0.7 p.p. more than in Q2 2010. This acceleration was contributed to mainly by the price development in 'food and non-alcoholic beverages', which after a slight decrease by 0.1% in Q2 turned to a rise by 3.7% in Q3.
The growth of market prices accelerated to 1.5% (from 0.9% in Q2) and administratively influenced prices to 3.7% (from 2.4% in Q2).
In 'food and non-alcoholic beverages' the year-on-year decrease in prices, lasting from Q1 2009, finished. Acceleration of the price growth or a slowdown of the price drop was recorded for all staple food in Q3 2010 (as it is obvious from the graph below). For example, prices of butter were higher by 21.1%.
Acceleration of the price growth took place also in 'housing, water, electricity, gas and other fuels'; it was a consequence of another price rise of natural gas by 4.2% since July. It caused a change in the y-o-y development in prices of natural gas from the drop by 6.5% in Q2 to a rise by 3.9% in Q3 2010. Prices of electricity were lower by 2.7%, the same as in Q1 and Q2 2010. The price growth of the net actual rentals slowed down to 9.0% (from 10.0% in Q2), of which for dwellings with regulated rentals rose by 17.0% and for dwellings with market rentals dropped by 0.5%.
In 'alcoholic beverages, tobacco' the rise in prices of tobacco products accelerated to 5.2% (from 3.7% in Q2) and prices of alcoholic beverages to 5.5% (from 4.4% in Q2).
In 'health', the increase in prices came from higher prices and fees paid by patients on prescription drugs by 12.9% and partly also by termination of payments of regulatory fees by regional offices.
A slowdown of price growth was recorded primarily for 'transport' due to automotive fuel prices, which increased by 12.3% in Q3 2010, y-o-y, while they were up by 18.7% in Q2. It was due to a month-on-month drop in automotive fuel prices in all months of Q3 2010. The price rise in 'transport' slowed down due to lower prices of cars by 12.4%.
In 'recreation and culture', prices of package holidays remained lower by 0.7% despite their marked quarter-on-quarter growth of prices (which was, however, similar to the previous year). Compared with 2009, prices of audio-visual and photographic equipment and data-processing equipment were also lower (-8.3%).
A moderate price decrease continued in clothing and footwear, household appliances, mobile phones and services provided by mobile phone operators.
Prices of total goods increased by 1.7% (from 0.5% in Q2) and prices of services by 2.3% (from 2.2% in Q2).
Harmonized index of consumer prices in the EU 27
According to preliminary data of Eurostat, the year-on-year increase in the average harmonized index of consumer prices (HICP) in the EU 27 member states was 2.1% in July and 2.0% in August. In the Czech Republic, these values were 1.6% and 1.5%, respectively in the same period. It means that the difference between y-o-y growth of HICP in the EU 27 and the Czech Republic started to decrease in Q3.
Contact: Information Services Unit - Headquarters, tel.: +420 274 056 789, email: infoservis@czso.cz


