
Analysis - Consumer price indices - 1 quarter
14.04.2010
Code: q-7132-10


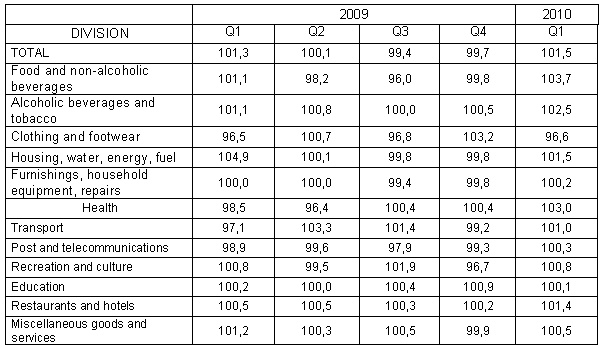
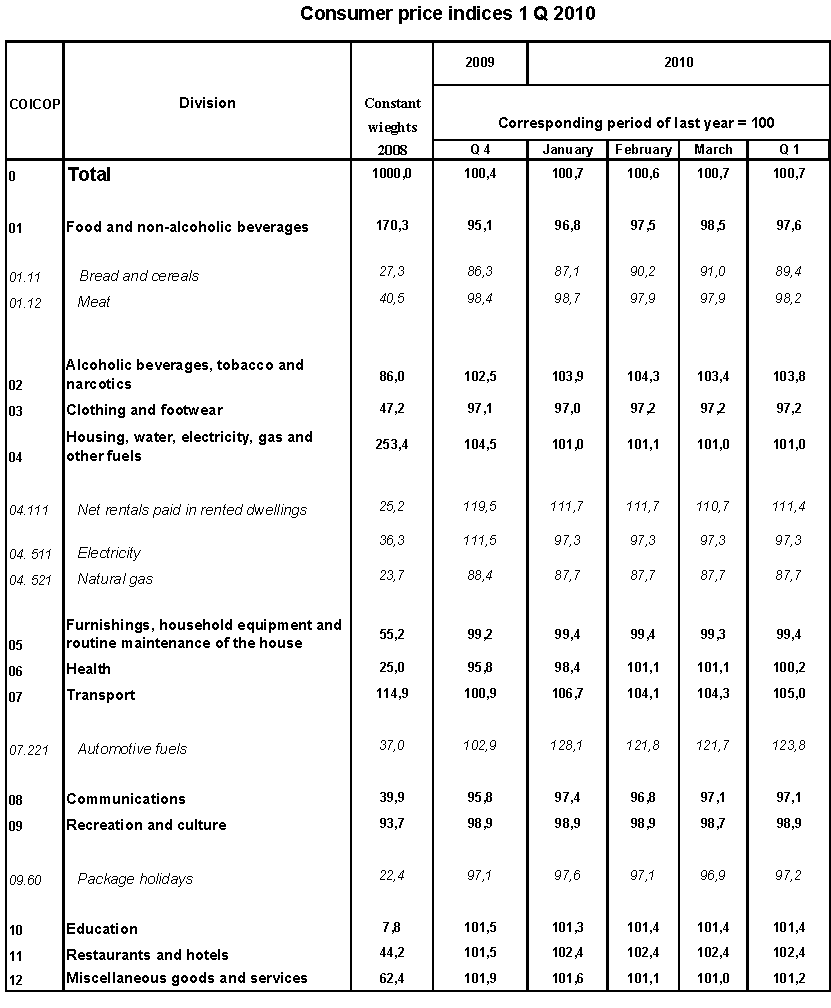
Consumer prices rose in Q1 2010 compared with Q4 2009 by 1.5 %, which is markedly more compared to the previous three quarters. The consumer price growth was contributed to by raising prices in January when an increase of basic and reduced VAT rate from 19% to 20% and from 9% to 10% was recorded accompanied by an increase of consumption tax on fuel and alcoholic beverages. This change affected the m-o-m total increase of the consumer price index in January, which, according to the CZSO approximate calculation, resulted into a 1 p.p. increase. The above suggests that in January when more marked price wobbles were usually recorded, this year’s price growth was relatively low, excluding the indirect tax impact.
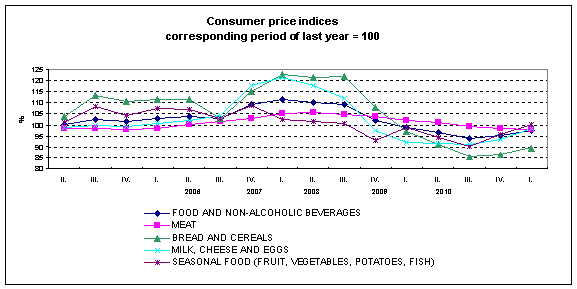
Besides higher indirect taxes the price level growth came especially from price increase in food and non-alcoholic beverages mainly due to an increase of seasonal prices of vegetables incl. potatoes by 30.6% and fruit by 9.6%. In housing, net actual rentals increased by 8.1% of which in dwellings with regulated rentals by 15.3% and in dwellings with market rentals a 0.8% drop was recorded. In 'health', prices and additional payments for medical products increased by 5.3%. A marked growth (+9.0%) was reported for fuel prices due to raising consumption tax and VAT and also due to the increasing world oil prices.
Compared to Q4 2009 lower were mainly prices of clothing (-3.7%), footwear (-3.2 %) due to sales of especially winter goods. Prices of motor vehicles dropped by 8.1%. In 'housing, electricity, water and other fuels' prices of electricity fell by 2.6% and prices of natural gas by 0.7%.
The average m-o-m growth rate in Q1 2010 was 0.5 %, while in Q4 2009 it made up only 0.1 %.
Consumer price indices
previous quarter = 100
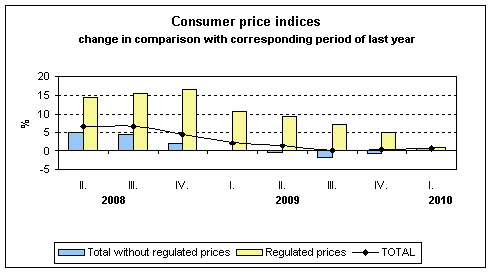
In Q1 2010 compared to Q1 2009 consumer prices raised by 0.7 %, y-o-y, which is by 0.3 p.p. more than in Q4 2009. This acceleration was contributed to mainly by the indirect tax increase which showed most in transport, alcoholic beverages and tobacco, food and non-alcoholic beverages, hotels and restaurants. At the same time, a slowdown of price growth of net actual rentals accompanied by price drop in electricity and natural gas was recorded. These wobbles resulted into a change in market price development from a 0.7% drop in Q4 to a 0.5% growth in Q1 2010. The administrative price growth slowed down to 1.0% (from 5.1% in Q4).
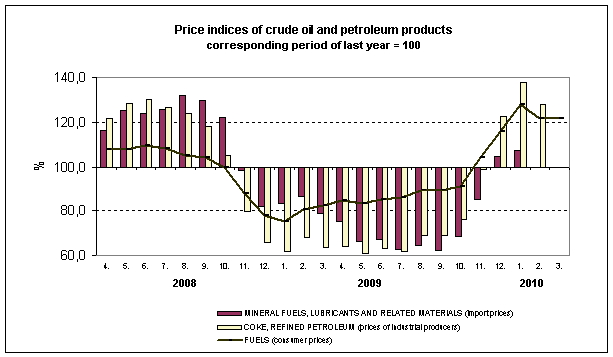
Transport in Q1 contributed most to the y-o-y growth of consumer prices and replaced so far dominant influence of housing. This development was attributed to by fuel prices, which in Q1 2010 increased, y-o-y, by 23.8% while in Q4 2009 were only by 2.9% up. This was partially contributed to by an increase of consumption tax on fuel by CZK 1/litre (petrol less than one third and motor oil approximately one fifth) and by an increase of VAT from 19 % to 20 %. However, the main reason was the growth of world oil prices (by 71.9 % in January). The price increase in transport was mitigated by a price drop of passenger cars by 10.7%.
In alcoholic beverages and tobacco prices grew due to higher consumption tax and VAT mainly in spirits by 3.4 %, wine by 1.3 % and beer by 6.6 %. The indirect tax increase has not so far showed in tobacco products; their y-o-y growth slowed down to 2.4% from 3.6% in Q4.
An acceleration of the y-o-y price growth occurred in hotels and restaurants where prices in restaurants increased by 2.2 % and in canteens by 3.1 %.
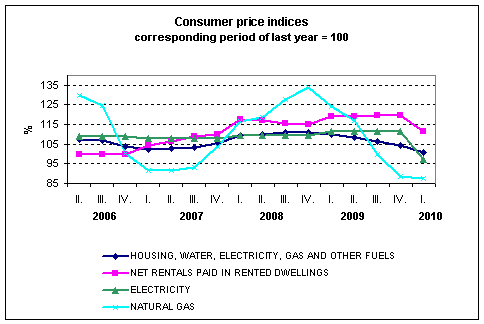
A slowdown of price growth was recorded mainly in housing, water, energy, fuel due to prices of energy, which instead of going up in January, recorded a drop this year. Prices of net actual rentals also reported a smaller increase compared to the last year which resulted into a deceleration of their y-o-y growth. The prices of electricity dropped, y-o-y, by 2.7 % compared to Q4 when they were 11.5 % up due to a different m-o-m price development in January 2009 (+11.6%) and in January 2010 (- 2.5 %). Natural gas prices were last increased in October 2008 and since they have been reduced several times slowing down gradually their y-o-y growth in 2009, which resulted into a drop in Q4 that in Q1 2010 became slightly more profound (-12.3%). Net actual rentals increased by 11.4% (of which in dwellings with regulated rentals by 18.9% and in dwellings with market rentals by 2.1%).
Lower than the last year were prices in five sections of consumer basket whose drop, however, slowed down. This applied mainly to prices in food and non-alcoholic beverages, which in Q1 2010 contributed most to the total price level decrease. Despite the VAT increase prices of many food remained lower than the last year. This development was also attributed to a significant drop of agricultural producer prices in 2009 especially in crop production. Prices of meat showed far smaller wobbles over the last four years.
A long-term moderate price drop was registered in clothing, household appliances, mobile phones and services provided by mobile phone operators, audiovisual and photographic equipment and data processing equipment.
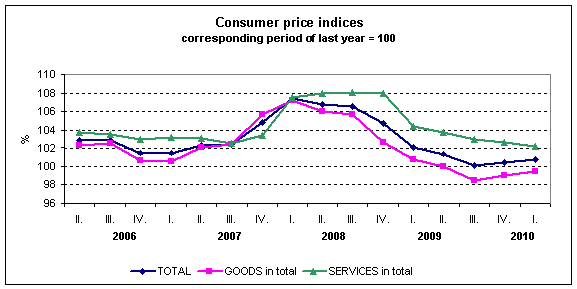
Prices of goods in total fell by 0.5 % (from –1.0 % in Q4) and price growth in services slowed down to 2.3 % (from 2.7% in Q4 2009).
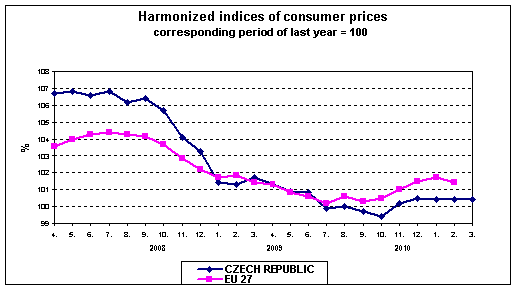
Harmonized index of consumer prices in the EU27
In the whole EU even in January a gradual increase of price growth continued and ended up in February. The y-o-y price growth resumed approximately the December value. The year-on-year increase in the average harmonized index of consumer prices (HICP) in the EU27 was 1.7 % in January, in February it slowed down, according to preliminary data, to 1.4%. The biggest price increase was registered in Hungary (+6.2 and +5.6%). For five countries a continuing y-o-y price drop was reported. The most marked price decrease was registered in Latvia (-3.3% and -4.3%). In the Czech Republic the y-o-y change of HICP was 0.4% in all three months of Q1. The development trend of HICP in EU27 and the Czech Republic was similar while in the CR bigger price wobbles were registered over the last two years.
Contact: Information Services Unit - Headquarters, tel.: +420 274 056 789, email: infoservis@czso.cz


