
Employment and Unemployment in the CR as Measured by the Labour Force Sample Survey - Annual Averages - 2006


| Code: e-3115-07 |
Information services: tel: 274 052 304 Email: infoservis@czso.cz Contact: Infoservis Email: infoservis@czso.cz |
Attachments
|
Introductory note
|
|
|
I. Basic methodological approaches
|
|
|
II. Explanatory notes on methodology
|
|
|
|
|
|
|
|
|
|
|
|
|
|
|
|
|
|
|
|
|
III. Technical notes
|
|
|
|
|
|
|
|
|
|
|
|
|
|
|
|
|
|
|
|
|
|
|
|
Tables |
|
|
I. Characteristic of population of the Czech Republic |
|
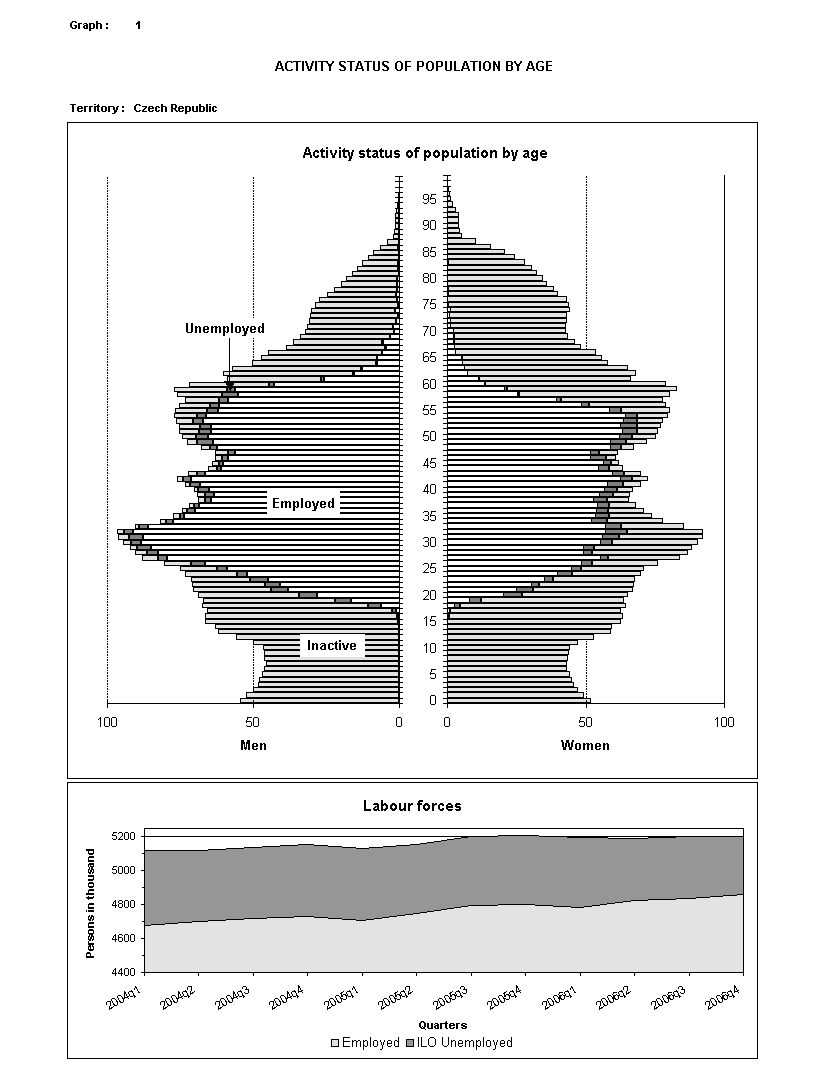
| Graph 1 Activity status of population by age | JPG |
| Tab. 101 / 3 Population of the Czech Republic by age | Excel PDF |
| Tab. 102 / 3 Population of the Czech Republic by education | Excel PDF |
| Tab. 103 / 3 Selected fields of education - ISCED 97 | Excel PDF |
| Tab. 104 / 3 Activity status of population aged 15 or more - total | Excel PDF |
| Tab. 104 / 3 Activity status of population aged 15 or more - men | Excel PDF |
| Tab. 104 / 3 Activity status of population aged 15 or more - women | Excel PDF |
| Tab. 105 / 1 Levels and fields of education by age groups - total | Excel PDF |
| Tab. 105 / 1 Levels and fields of education by age groups - men | Excel PDF |
| Tab. 105 / 1 Levels and fields of education by age groups - women | Excel PDF |
| Tab. 106 / 2 Age and education of the population by activity status - total | Excel PDF |
| Tab. 106 / 2 Age and education of the population by activity status - men | Excel PDF |
| Tab. 106 / 2 Age and education of the population by activity status - women | Excel PDF |
| Tab. 107 / 3 Main reasons for economic inactivity | Excel PDF |
| Tab. 108 / 1 Persons with disability | Excel PDF |
| Tab. 109 / 1 Population 15+ by activity status one year ago | Excel PDF |
|
II. Employment in national economy |
|
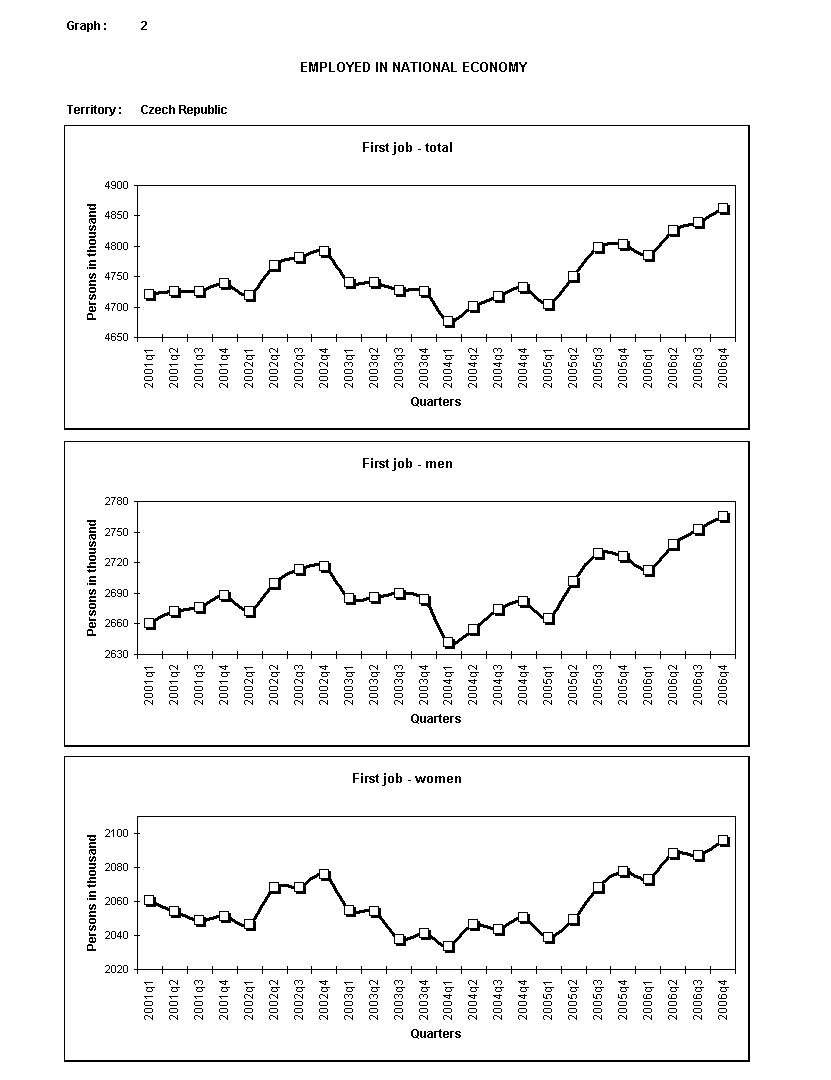
| Graph 2 Employed in national economy | JPG |
| Tab. 201 / 3 Employment in national economy by regions - part 1 - total | Excel PDF |
| Tab. 201 / 3 Employment in national economy by regions - part 1 - men | Excel PDF |
| Tab. 201 / 3 Employment in national economy by regions - part 1 - women | Excel PDF |
| Tab. 202 / 3 Employment in national economy by regions - part 2 - total | Excel PDF |
| Tab. 202 / 3 Employment in national economy by regions - part 2 - men | Excel PDF |
| Tab. 202 / 3 Employment in national economy by regions - part 2 - women | Excel PDF |
| Tab. 203 / 1 Employment in national economy by age - part 1 | Excel PDF |
| Tab. 204 / 1 Employment in national economy by age - part 2 - total | Excel PDF |
| Tab. 204 / 1 Employment in national economy by age - part 2 - men | Excel PDF |
| Tab. 204 / 1 Employment in national economy by age - part 2 - women | Excel PDF |
| Tab. 205 / 2 Employment in national economy by areas - total | Excel PDF |
| Tab. 205 / 2 Employment in national economy by areas - men | Excel PDF |
| Tab. 205 / 2 Employment in national economy by areas - women | Excel PDF |
| Tab. 206 / 1 Employment in national economy by education | Excel PDF |
| Tab. 207 / 1 Classification of occupations by economic activity | Excel PDF |
|
III. Employment in civil sector |
|
| Tab. 301 / 3 Status in employment in sectors | Excel PDF |
| Tab. 302 / 1 Employment in civil sector by professional status and by industry | Excel PDF |
| Tab. 303 / 1 Employment in civil sector by professional status, classification of occupation and educational attainment | Excel PDF |
| Tab. 304 / 1 First job holders: by selected economic activity | Excel PDF |
| Tab. 305 / 1 Employment by professional status, type of contract and job duration | Excel PDF |
| Tab. 306 / 1 Employment in civil sector on work contract with limited duration – total | Excel PDF |
| Tab. 306 / 1 Employment in civil sector on work contract with limited duration – men | Excel PDF |
| Tab. 306 / 1 Employment in civil sector on work contract with limited duration – women | Excel PDF |
| Tab. 307 / 3 Hours usually and actually worked in the week | Excel PDF |
| Tab. 308 / 1 Hours worked by industry and job distinction | Excel PDF |
| Tab. 309 / 2 Hours actually worked by status in employment | Excel PDF |
| Tab. 310 / 1 Hours actually worked by status in employment and age | Excel PDF |
| Tab. 311 / 1 Part-time jobs and underemployment | Excel PDF |
| Tab. 312 / 1 Employment in civil sector on short-time work | Excel PDF |
| Tab. 313 / 1 Work in atypical time in civil sector | Excel PDF |
| Tab. 314 / 2 Work status and disability | Excel PDF |
|
IV. Unemployment |
|
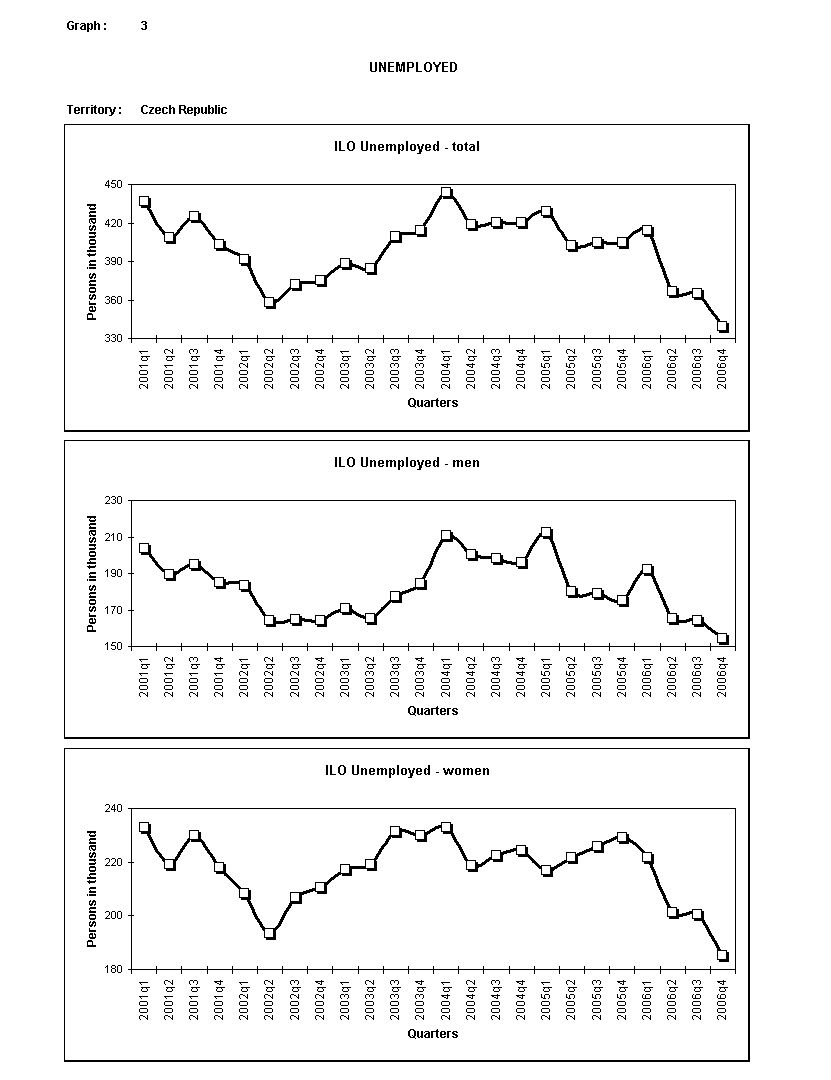
| Graph 3 Unemployed | JPG |
| Tab. 401 / 3 Age, education and specific groups of unemployed | Excel PDF |
| Tab. 402 / 1 Basic characteristics of unemployed | Excel PDF |
| Tab. 403 / 1 Education of unemployed in age groups | Excel PDF |
| Tab. 404 / 1 Last industry and occupation of unemployed by education | Excel PDF |
| Tab. 405 / 1 Job seeking conditions | Excel PDF |
| Tab. 406 / 2 Unemployment in areas of the Czech Republic | Excel PDF |
| Tab. 407 / 1 Long-term unemployment by educational attainment | Excel PDF |
| Tab. 408 / 3 Long-term unemployment in the Regions of Czech Republic | Excel PDF |
|
V. Times series of basic indicators |
|
| Tab. 501 / 1 First job - part 1 - total | Excel PDF |
| Tab. 501 / 1 First job - part 1 - men | Excel PDF |
| Tab. 501 / 1 First job - part 1 - women | Excel PDF |
| Tab. 502 / 1 First job - part 2 - total | Excel PDF |
| Tab. 502 / 1 First job - part 2 - men | Excel PDF |
| Tab. 502 / 1 First job - part 2 - women | Excel PDF |
| Tab. 503 / 1 Second job - part 1 | Excel PDF |
| Tab. 504 / 1 Second job - part 2 - total | Excel PDF |
| Tab. 504 / 1 Second job - part 2 - men | Excel PDF |
| Tab. 504 / 1 Second job - part 2 - women | Excel PDF |
| Tab. 505 / 1 Unemployment - part 1 - total | Excel PDF |
| Tab. 505 / 1 Unemployment - part 1 - men | Excel PDF |
| Tab. 505 / 1 Unemployment - part 1 - women | Excel PDF |
| Tab. 506 / 1 Unemployment - part 2 | Excel PDF |
| Tab. 507 / 1 Unemployment rate - total | Excel PDF |
| Tab. 507 / 1 Unemployment rate - men | Excel PDF |
| Tab. 507 / 1 Unemployment rate - women | Excel PDF |
| Tab. 508 / 1 Economic activity rate - total | Excel PDF |
| Tab. 508 / 1 Economic activity rate - men | Excel PDF |
| Tab. 508 / 1 Economic activity rate - women | Excel PDF |
| Tab. 509 / 1 Employment rate - total | Excel PDF |
| Tab. 509 / 1 Employment rate - men | Excel PDF |
| Tab. 509 / 1 Employment rate - women | Excel PDF |
|
ANNEX |
|
| Tab. Ia Estimates of 95 % confidence interval of basic estimates for population aged 15+ | Excel PDF |
| Tab. Ib Estimates of 95 % confidence interval of basic estimates for population aged 15+ by sex | Excel PDF |
| Tab. IIa Estimates of 95 % confidence interval of partial estimates for population aged 15+ at the national level | Excel PDF |
| Tab. IIb Estimates of 95 % confidence interval of partial estimates for population aged 15+ at the national level by sex | Excel PDF |
| Tab. III Relative sample sizes in Regions, Areas and the Czech Republic | Excel PDF |
Published: 29.06.2007
The data are valid as of the release date of the publication.


