Economic activity of the population - 4 quarter
07.02.2010
Code: q-3133-09
a) Changes in the structure of economic activity status of the population in the CR
Since 2003 the total number of the population has showed a continuous growth. Over the last three years the annual increases were markedly high. According to the sample survey results the number of the population in the CR increased between Q4 2006 and Q4 2009 by almost a quarter of million persons (254 thousand). This growth, however, showed in individual groups of economic activity status rather differently. The number of children (age group 0-14) increased over three years by mere 12 thousands and approached the limit of 1.5 million. The number of the employed increased over the same period by almost 66 thousand and the number of the unemployed by almost 46 thousand persons (i.e. slightly more than 1% and + 13.5%, respectively).
The biggest growth was reported for the number of non-active persons in the productive and post-productive age. An increase in this category of economic activity status made almost one half of the whole population increase (i.e. +122 thousands) over three years.
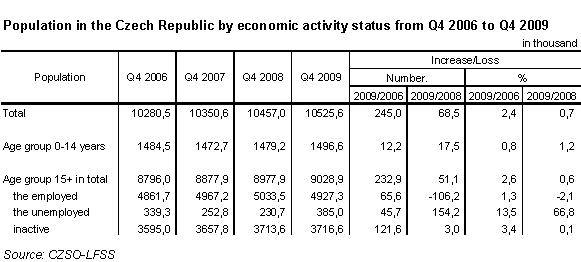
The structure of economic activity status of the population is heavily impacted, in addition to natural change in the age structure of the population, by social and economic factors. This applies mainly to the growth of unemployment in 2009, extension of the retirement age limit and extension of the time of education. All these factors show in the percentage of the employed in the total population of the CR (including children). If in Q4 2006 47.3% of the population of the CR were job-holders, this percentage grew to 48.0% in the corresponding period in 2008. The negative economic development then showed in the last year when in Q4 the percentage of the employed was only 46.8%.
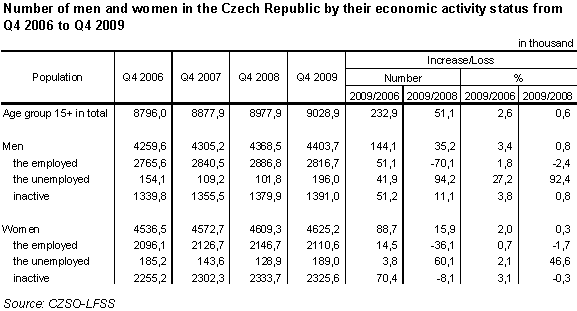
The number of economically inactive women in the age group 15+ reached in Q4 2009 almost 2 326 thousand and markedly exceeded the same category of men (1 391 thousand). Over three years the number of these women increased by 70 thousand, the number of inactive men raised by 51 thousand. In 2009, the number of inactive women slightly dropped to set off the increase in the number of inactive men. The total number of economically inactive persons of the age group 15+ increased only intangibly compared with Q4 2008.
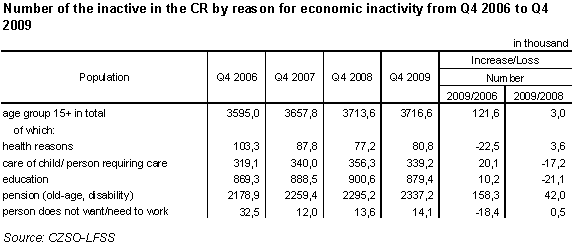
The number of inactive persons of the age group 15+ showed an annual increase, however, representation of respondents by reason for their economic inactivity developed conflictingly. The biggest increase was clearly reported for the group of inactive persons due to receiving their pensions. This applies to persons who did not work and neither did they seek for job actively. Their number increased over three years by more than 158 thousand which is more than the total increase in all inactive persons in productive and post-productive age. The big growth of the number of inactive pensioners showed also in the last year.
In the reported period the second most numerous groups of inactive persons due to education grew, too. The total increase of young people in the process of education was substantially lower than the increase of the number of pensioners when in the last year their number even dropped, y-o-y, by more than 21 thousand. However, the internal structure of the group of persons in the process of preparation for their future employment developed conflictingly. The declining number of students and apprentices at the secondary level was clearly due to the on-going demographic changes. The number of inactive university students or students at doctoral level (ISCED 5, 6) increased, by contrast, over three years by more than 55 thousand to 335 thousand. This growth 5times exceeded the total increase of the number of students, apprentices and pupils of primary schools at the age of 15+.
In the process of data assessment the methodology of sample survey should be accepted. This applies solely to a group of economically inactive persons who in the reference period did not work nor were active to find a job. Pensioners and students who in the reference week worked at least one hour are classified and the employed and, similarly, pensioners and students who do not have any employment but are actively seeking for one and are able to start working within a fortnight at the latest, are classified as the unemployed. Due to the above it is not possible to directly compare the numbers of inactive pensioners and students with the complete records of pensioners as kept by the Czech Social Security Administration and with the school education statistics.
In the third and most numerous group of persons inactive due to care of a child or other person requiring systematic care the development was similar as in the group of persons involved in the process of education. Despite the drop in numbers of these persons over the last year, their numbers over three year slightly increased by 20 thousand. By contrast, the total number in the other group of the inactive due to health reasons dropped in total over three years. Similarly, the number of the inactive in other groups of persons who did not seek for work, decreased. This applies to inactive persons who do not want or do not need to work, persons who declare that they will not find suitable job and to the group of respondents who do not work due to personal reasons.
b) Percentage of economically inactive persons in the total number of persons of the age 15+ in the EU countries
Labour force sample survey enables to immediately compare the results for individual member countries within the entire EU. The shares of economically inactive in the total number of the age group 15+ or individual five-year age groups are published regularly.
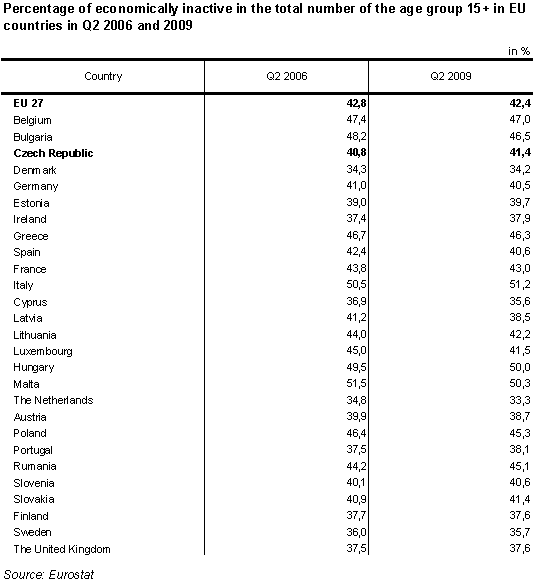
Comparison of data for the entire group of persons in productive and post-productive age suggests that in the Czech Republic the share of the inactive is lower (in Q2 2009 41.4 % in the age group 15+) than was the average for the whole EU 27 (42.4 %). Compared to Q2 2006 there is, however, a very obvious different trend in the development of this percentage. While within EU 27 the percentage dropped over three years by 0.4 p.p., in the Czech Republic it increased by 0.6 p.p. within the same period.
Difference between individual countries is significant. While in three countries (Italy, Hungary and Malta) the percentage of the inactive who did not seek for work made at least 50% of the population of the age group 15+, in eleven countries the percentage did not even reach 40% of all the population in productive and post-productive age. While in the Netherlands and Denmark the percentage was only one third of the population of the above age group.
To show the differences between the counties the last complete results for Q2 2009 were used and compared with the data for Q2 2006. This procedure enables to avoid seasonal wobbles in terms of size of some groups of respondents, especially students, over the year.
Differences between countries can be documented by the percentage of inactive in those age groups who significantly influence the total inactivity rate in groups of persons of young productive age and persons on the verge of productive and post-productive age.
As for the youngest age group of 15-19 years the Czech Republic belongs to three countries with the biggest share of inactive persons within the whole EU. Generally it can be said that very low economic activity at this age is typical for countries of Central and Eastern Europe when high percentage of the inactive within this five-year group was recorded in Hungary. By contrast, lower percentage of the inactive was reported for Northern countries and the Netherlands while these countries rank among the countries with high standard of living and good social conditions. Big difference refers to both boys and girls within the above age group.
This significant difference in percentage of the inactive shows in the age group 20-24 years, i.e. the group with big number of students at tertiary level. While for the whole EU 27 the percentage of the inactive was a bit more than one third of the age group 20-24 years (36.8 %), in the Czech Republic the percentage made almost a half of all respondents (47.7 %). In Hungary and Rumania this percentage exceeded 55 %. Like in the youngest five-year group of persons of the productive age, the smallest percentages of the inactive show the Northern countries and the Netherlands and also in Austria, the United Kingdom, Ireland and Germany.
This fact should be assessed on the basis of more detailed analyses of reasons causing differences. These may result from a different concept of education in the above countries compared to other countries. This applies mainly to respondents involved in the process of education and at the same time showing work activity in the reference period. The detailed analysis should be aimed at differences in the concept and security of the process of education including the standard age at which the studies are finished (mainly at tertiary level). This subject should be dealt with by work places focused on the process of education. The possible impact of the use of other sources of information on the results of sample survey for individual countries, e.g., the population register, should also be taken into consideration.
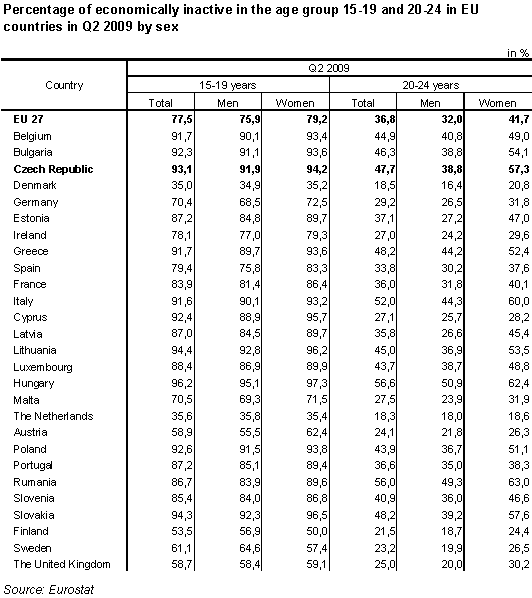
In the age group of 25-29 the percentage of the inactive between individual countries is balanced although also in this case notable differences survive (in the Netherlands the share amounted to 9.6 % compared to Rumania with 27.2 % and Italy with even 28.9 %). This suggests that the rate of economic activity of young people up to 30 in Northern countries and the Netherlands is one of the main reasons of higher total economic activity in these countries compared to other EU countries.
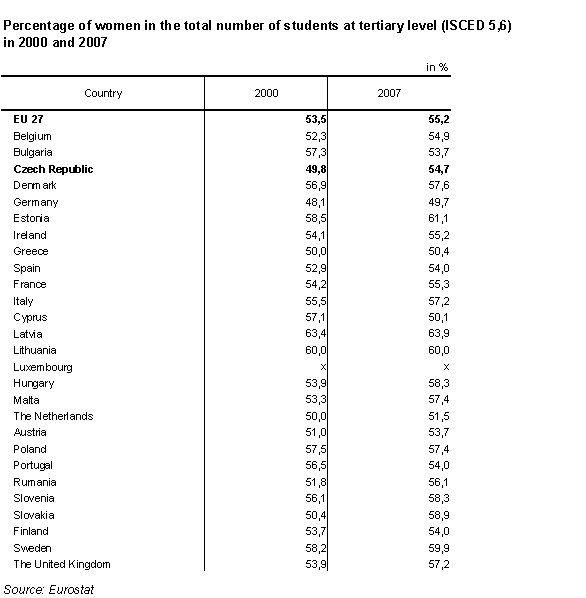
Eurostat does not publish data on numbers and shares of the inactive by individual reasons of their inactivity. However, other results suggest that the total activity (or inactivity) is significantly affected by changes in the number of students at tertiary level (ISCED 5 and 6). According to available annual data in the entire EU the number of university students increased between 2000 and 2007 by almost 20 % (index 118.6). In many countries, however, this increase was markedly bigger. In the Czech Republic the number of these students increased by more than 40 % (index 142.9), while in Slovakia this index reached 160.4 and in Lithuania 164.0. Relatively biggest increase of university students was reported for two countries – Cyprus and Rumania where the number of students over seven years more than doubled.
Given generally fast growth of the number of university students another fact shows – continuing feminisation of this group of students. While in 2000 the percentage of female students in the total number of university students made 53.5 %, in 2007 in grew in the entire EU 27 to 55.2 %. This increase showed almost in all member countries, only in Germany the percentage of female students made in 2007 almost 50% of all university students. Specific situation is an all three Baltic countries where the percentage of women in the number of all university students exceeded 60%.
Big differences in the percentage of the inactive are notable also in the age group 55+. In the five-year age group of 55-59 the CR belongs to countries with low percentage of the inactive. In EU 27 in Q2 2009 the share made 35.7 %, in the Czech Republic only 28.9 %. In majority of member countries save for Lithuania and Hungary the percentage of the inactive of this age group dropped over three years, in EU 27 by 4.5 p.p. and in the Czech Republic by 4.1 p.p. This drop was clearly a consequence of increasing of active life and retirement age limit.
Similarly like in groups of the youngest productive age also in this case the share of the inactive is very low especially in Northern and Baltic countries, in Germany and the United Kingdom. By contrast, in Poland and Malta more than a half of the population of this age was economically inactive. These differences are obvious in male and female segment of the population. Generally the share of the inactive in this five-year group save for exceptions dropped both for men and women, however, big difference between individual countries survive.
Sharp growth in the percentage of the inactive is apparent upon reaching 60 years of age. Percentage of the inactive of the age group 60-64 for the entire EU 27 made more than 2 thirds of all respondents of this age. In the Czech Republic the percentage was more than 72 % and our country ranks among the countries with below-the-average economic activity of this age group. Although, due to the increase of the retirement age limits in the CR the more marked drop of the number of the inactive compared to EU 27 was registered;. this drop was significantly bigger in other countries, such as Germany, Netherlands and Luxembourg. Big drop of the number of the inactive showed also in Baltic countries such as Latvia and Lithuania even thought these countries were strongly hit by economic and financial crisis. Despite the drop of percentage of the inactive in majority of countries, big differences survive in term of economic activity of the population. In Hungary the activity of persons at the age 60+ is very low and the similar situation is reported for Poland and Slovakia. By contrast, majority of the population in Sweden work at this age or is actively seeking for work (almost two thirds).
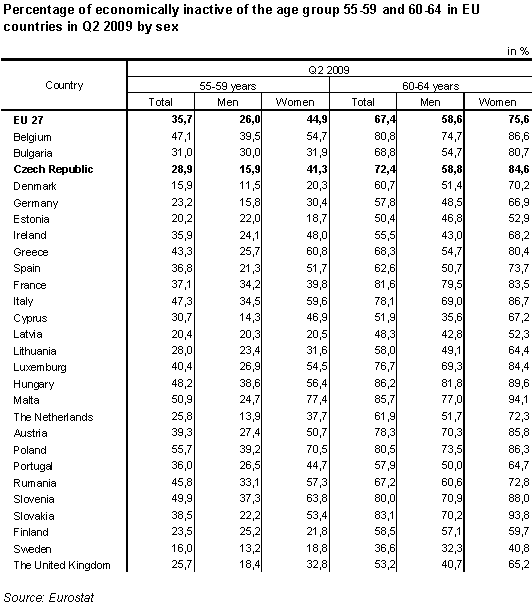
In terms of differences in intensity of work activity between men and women of this age group the Czech Republic belongs to countries with the biggest difference in percentage of inactive women and men of this age in the entire EU. This is mainly due to low activity of women, which refers e.g. to Slovakia, Poland, Hungary and Austria. The share of inactive women in EU 27 decreased over three years, nevertheless, three quarters of women of this age are classified as inactive (almost 85% of women in the CR).
***
Economic activity of the population results from given social and economic conditions of employment which are markedly different in the EU. Significant influence on the number of the inactive population of the age group 15+ is the level of economic activity of the youngest groups of productive age and age groups between productive and post-productive age. Favourable conditions for employment are mainly in Northern countries including the Netherlands where the economic activity of young persons and persons over 60 is markedly higher compared to other EU countries.
Contact: Information Services Unit - Headquarters, tel.: +420 274 056 789, email: infoservis@czso.cz


