
Development of external trade price indices - 3 quarter
18.11.2010
Code: q-7232-10


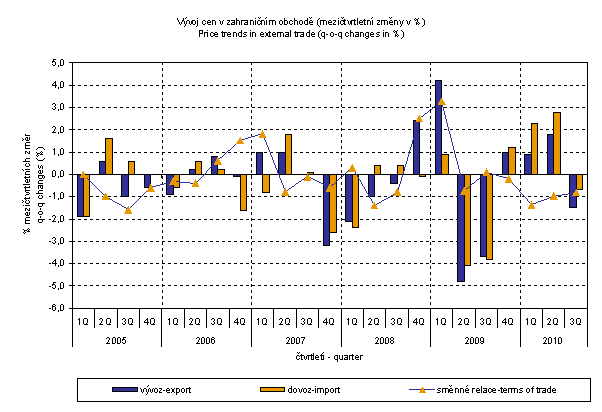
Quarter-on-quarter (q-o-q) comparison:
Export prices in Q3 of 2010 compared to Q2 of 2010 decreased by 1.5% (in Q2 they increased by 1.8%). Import prices decreased by 0.7% (in Q2 they rose by 2.8%).
In export prices the largest drops were noticed in 'machinery and transport equipment’ by 2.6%, 'chemicals and related products' by 2.1%, and 'miscellaneous manufactured articles' by 1.5%. Prices of 'manufactured goods classified chiefly by material' stayed the same. Among the more important groups prices grew in 'mineral fuels, lubricants and related materials' by 2.9% and 'food and live animals' by 2.0%.
In import prices more important price drops were recorded in 'mineral fuels, lubricants and related materials' by 4.6%, 'food and live animals' by 3.2%, 'machinery and transport equipment’ by 1.5%, and in 'miscellaneous manufactured articles' by 0.8%. Among the more important groups prices grew in 'crude materials, inedible, except fuels' by 18.2% and 'manufactured goods classified chiefly by material' by 0.8%.
The terms of trade figures in Q3 of 2010 compared to Q2 of 2010 rose to 99.2% (in Q2 they were 99.0%), nevertheless, they still remained in negative values. Among more important groups, negative values were recorded in 'crude materials, inedible, except fuels' (84.4%), 'chemicals and related products' (98.4%), 'machinery and transport equipment' (98.9%), and in 'manufactured goods classified chiefly by material' (99.2%). On the contrary, the highest positive values of terms of trade were reached in 'mineral fuels, lubricants and related materials' (107.9%) and 'food and live animals' (105.4%).
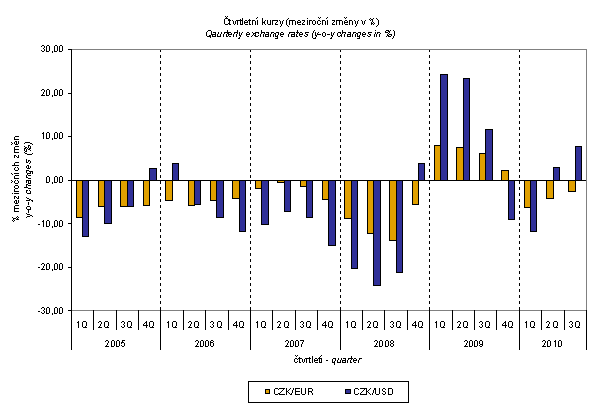
The external trade price development was also significantly affected by the CZK exchange rate to the major foreign currencies. The q-o-q exchange rate index includes two most important currencies from the Czech Republic’s external trade point of view, i.e. EUR and USD. Q-o-q indices of the CZK exchange rate to these currencies were weighted by the weight, which pertains to those foreign currencies in the export price index and import price index, respectively.
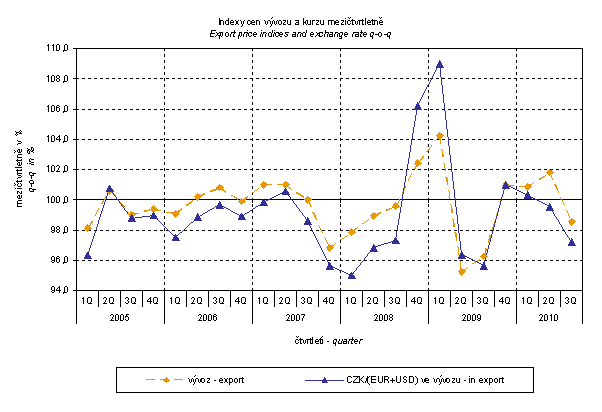
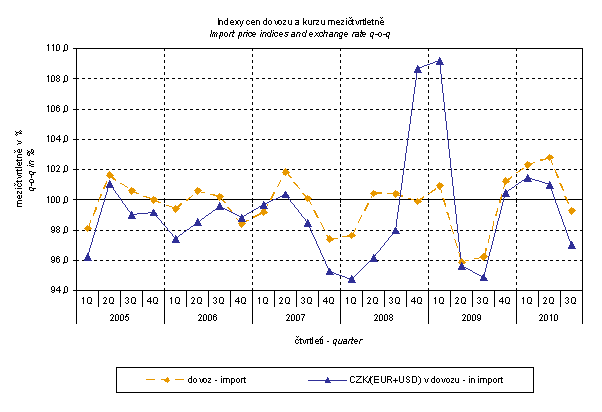
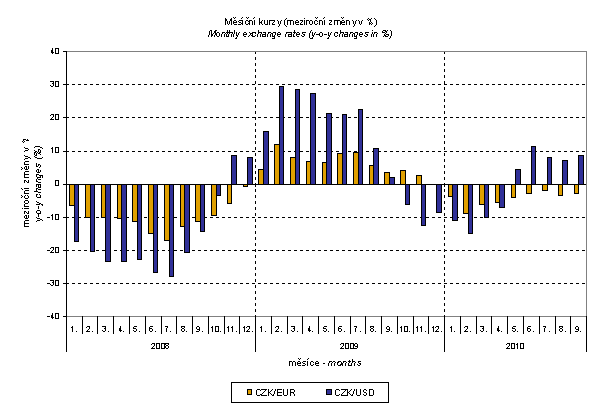
It can be seen from graphs above that in both cases of imports and exports external trade prices have a strong relation to exchange rate impacts. This relation could certainly be even stronger in the month-on-month (m-o-m) comparison; however, also in the q-o-q index it is relatively strong as the graphs demonstrate. This conclusion is understandable because contracts with foreign entities are, as a rule, signed for a longer period of the time and the longer the contract period is, the stronger the relation to exchange rates is.
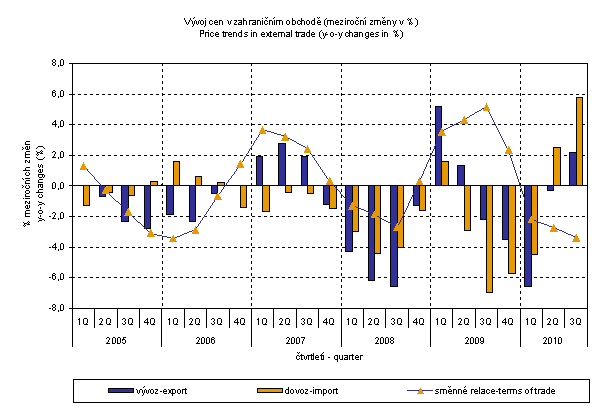
Year-on-year (y-o-y) comparison:
Export prices in Q3 of 2010 increased by 2.2% (in Q2 they dropped by 0.3%). More significant growth was reported for prices of 'crude materials, inedible, except fuels' by 29.2%, 'mineral fuels, lubricants and related materials' by 15.9%, 'chemicals and related products' by 7.2%, and 'manufactured goods classified chiefly by material' by 3.9%. Prices fell in 'machinery and transport equipment' by 1.2%, and those of 'miscellaneous manufactured articles' by 0.4%.
Import prices in Q3 of 2010 increased by 5.8% (in Q2 by 2.5%). Highest growth of prices was for 'crude materials, inedible, except fuels' by 28.5%, 'mineral fuels, lubricants and related materials' by 25.7%, and 'manufactured goods classified chiefly by material' by 5.5%. Prices of ‘beverages and tobacco’ were the only ones that dropped by 2.7%.
Terms of trade in Q3 of 2010 fell to the value of 96.6% (by 0.7 p.p. less than in Q2) and they have continued in showing negative values for the third quarter – see graph below. Negative values were recorded for 'mineral fuels, lubricants and related materials' (92.2%), 'machinery and transport equipment' (96.9%), 'manufactured goods classified chiefly by material' (98.5%), and 'miscellaneous manufactured articles' (99.4%). Among more important groups, positive values of terms of trade were recorded in 'chemicals and related products' (105.0%) and those of 'crude materials, inedible, except fuels' and 'food and live animals' were identical at 100.5%.
As it was given here above, external trade prices are exposed to many effects, among others, also to the CZK exchange rate to foreign currencies. This influence is important and often even the decisive one. It is most pronounced in m-o-m expression; but it is also very significant in the quarter-on-quarter comparison and substantially affects the level of y-o-y external trade price indices. In Q1 of 2010 the CZK exchange rates to EUR and USD strengthened and forced prices to drop further, in Q2 and Q3 of 2010 the CZK exchange rate to EUR was still strengthening, yet that to USD was weakening. This resulted into an increase of import prices (see graph above). The development of quarterly exchange rates (y-o-y changes) is demonstrated in graph below.
External trade price indices adjusted y-o-y by exchange rate
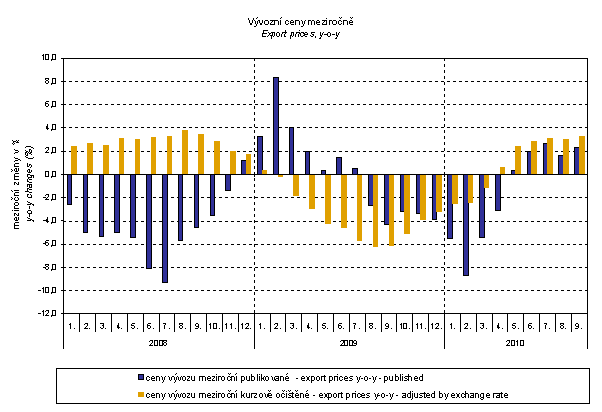
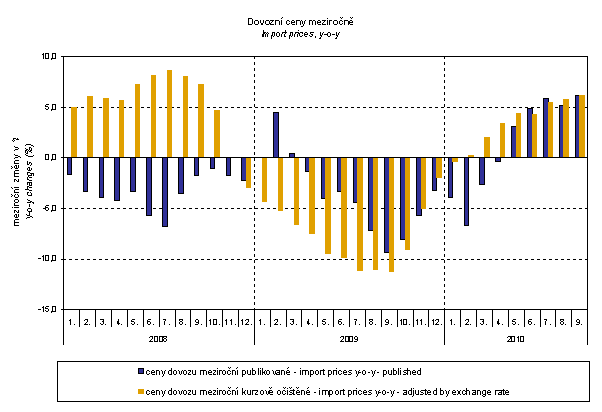
The CZSO carries out experimental calculations of monthly external trade price indices adjusted for exchange rate influence. The method used does not allow, for many practical reasons, to make a 100% exchange rate adjustment (i.e. not all observed deals made in foreign currencies are also reported as such for the needs of calculations of external trade price indices – their share makes only up to 30%). Yet it was verified that despite the increasing share of reporting in foreign currencies the currency basket remains almost constant. It can be stated that at the full exchange rate adjustment the differences between the published price indices and the price indices that were adjusted would get even enlarged.
It holds in general that the exchange rate influence decreases the value of price indices in external trade if CZK is strengthening to foreign currencies in total. Conversely, the exchange rate influence pushes the price indices up if CZK is weakening to foreign currencies in total. Following graphs show how significant was the exchange rate impact on the value of export and import price indices.
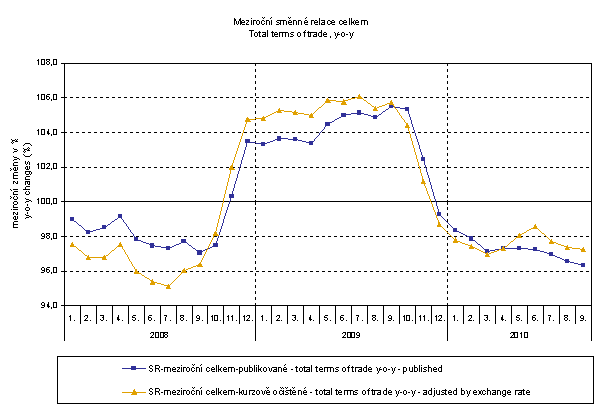
It can be seen from graph above how the exchange rate influences the value of year-on-year terms of trade.
How would the value of terms of trade develop if the observed groups would not include 'mineral fuels, lubricants and related materials'?
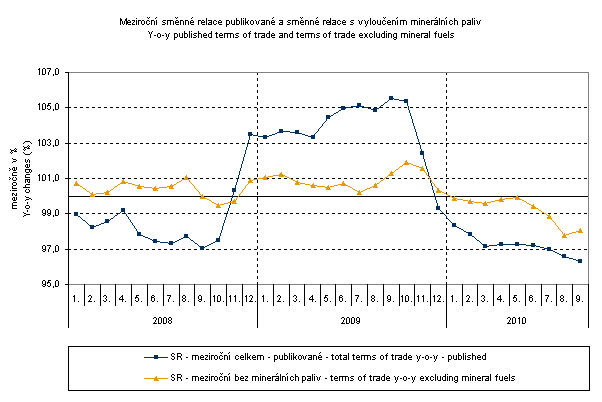
It can be observed in graph above that 'mineral fuels, lubricants and related materials' reduced the overall value of y-o-y terms of trade in the period from January to October 2008. By contrast, from November 2008 to November 2009 'mineral fuels, lubricants and related materials' had an upward effect on the terms of trade. It is most obvious just in Q2 and Q3 of 2009. In Q4 of 2009 the situation began to reverse and in December 2009 'mineral fuels, lubricants and related materials' again had a downward effect on the value of terms of trade. It is, of course, related to the world market price development, especially in crude oil. Import prices, which, compared to export prices, include higher proportion of crude materials, respond in a more sensitive way to price turbulences and therefore when prices of crude materials go up, terms of trade, as a rule, go down and, conversely, when prices of crude materials fall, terms of trade grow.
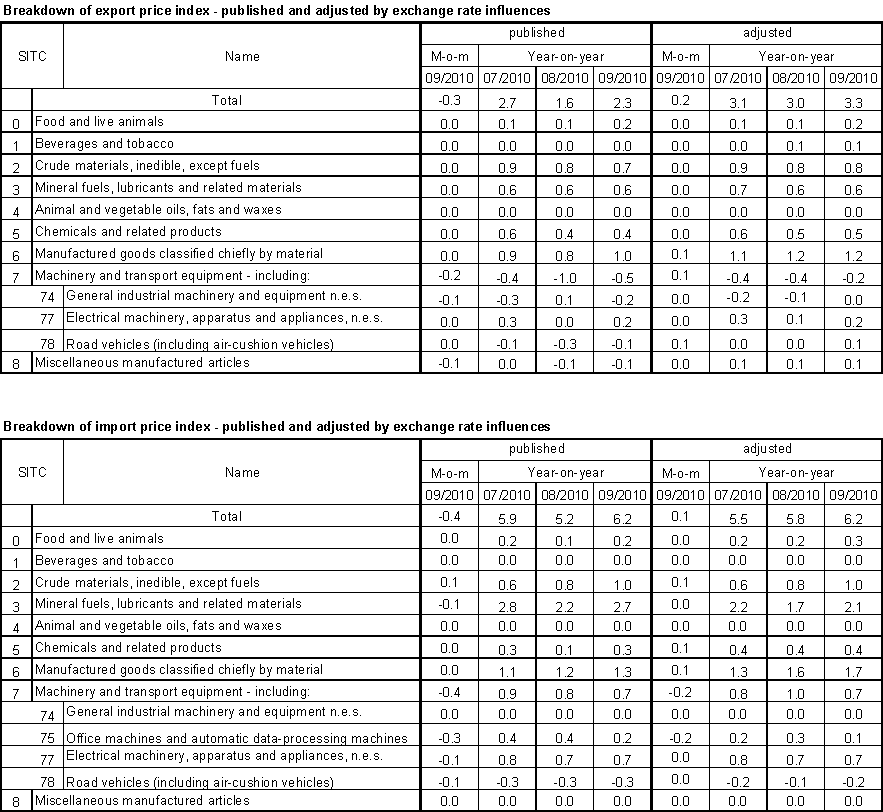
Following table shows the published breakdown of increases in export and import price indices adjusted by exchange rate influences (News Releases, Table 2). Table has been expanded by the most important double-digit groups of the SITC 7. This decomposition illustrates well how many percentage points each group "contributes" to the index.
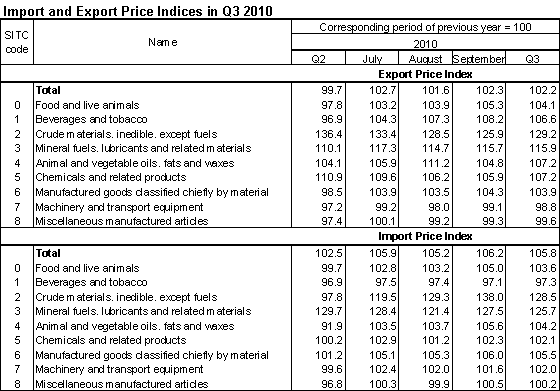
Closing table gives published external trade price indices without adjustment.
Developed by: Vladimír Klimeš, Price Statistics Department
Department Director: Jiří Mrázek, tel. (+420) 274 052 533
Contact: Information Services Unit - Headquarters, tel.: +420 274 056 789, email: infoservis@czso.cz


