
Statistical Yearbook of the Jihomoravský Region - 2014
Graphs
Attachments
| Graph 1. Selected indicators on the Jihomoravský Region in comparison with the Czech Republic average in 2013 | JPG |
| Graph 2.Land use in the Jihomoravský Region as at 31 December | JPG |
| Graph 3.Monthly precipitation on the territory of the Jihomoravský Region in 2013 | JPG |
| Graph 4.Environmental protection investments by region of the investor registered office in 2013 | JPG |
| Graph 5. Waste management by selected management method in 2013 | JPG |
| Graph 6. Waste generated by enterprises by registered in 2013 | JPG |
| Graph 7. Age distribution of the population in the Jihomoravský Region in 2013 and 2035 | JPG |
| Graph 8.Shares of live births in marriage and outside marriage by region in 2013 | JPG |
| Graph 9. Foreigners in the Jihomoravský Region | JPG |
| Graph 10.Gross value added by CZ-NACE | JPG |
| Graph 11.Gross fixed capital formation per capita by region (CR average=100) | JPG |
| Graph 12.Local budget expenditure in the Jihomoravský Region | JPG |
| Graph 13. Average annual net money income per person | JPG |
| Graph 14. Average monthly gross wages (full-time equivalent)- workplace method | JPG |
| Graph 15. Share of unemployed persons (%) and number of job applicants per 1 vacancy, by Region, as at 31 December 2013 | JPG |
| Graph 16. Share of the unemployed persons in Jihomoravský region (by the end of month) | JPG |
| Graph 17.Livestock in the Jihomoravský Region (on terms of the surveys) | JPG |
| Graph 18. Average monthly gross wage per employee in industry by region | JPG |
| Graph 19.Construction work according to contracts, 2013 | JPG |
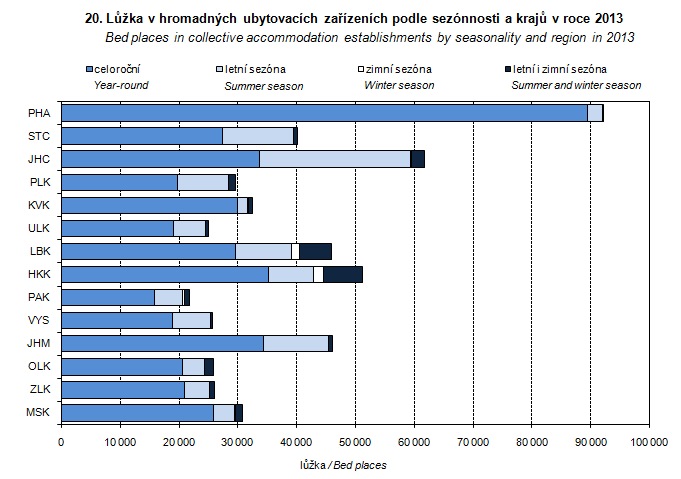
| Graph 20. Bed places in collective accommodation establishments by seasonality and region in 2013 | JPG |
| Graph 21. Motor vehicles in the Jihomoravský region (as at 31 December) | JPG |
| Graph 22. Share of hoseholds in the Jihomoravský region having a personal computer and Internet acces | JPG |
| Graph 23. R&D expenditure in the Jihomoravský Region in 2004-2013 | JPG |
| Graph 24.Students of public and private universities in the Jihomoravský Region | JPG |
| Graph 25. Average percentage of incapacity for work on health by district the Jihomoravský region | JPG |
| Graph 26.Old-age pension recipients by pension amount as at December 2013 | JPG |
| Graph 27.Traffic accidents in the Jihomoravský region | JPG |
| Graph 28. Voter turnout in elections to the European Parliament by district the Jihomoravský region | JPG |
| Graph 29. Voter turnout in the 2014 elections by region | JPG |
| Graph 30. Population by age by administrative districts of MEP in the Jihomoravský region as at 31 December 2013 | JPG |
| Graph 31. Selected indicators of the cohesion region by region in 2013 | JPG |
Published: 29.12.2014
The data are valid as of the release date of the publication.


