
Statistical Yearbook of Prague - 2016
Graphs
Attachments
| Graph 1. Selected indicators on the Capital City of Prague in comparison with the Czech Republic average in 2015 | JPG |
| Graph 2. Monthly precipitation on the territory of the Capital City of Prague in 2015 | JPG |
| Graph 3. Emissions of main pollutants into air in 2014 | JPG |
| Graph 4. Environmental protection investments by region of the investor registered office in 2015 | JPG |
| Graph 5. Waste generated by enterprises by registered office in 2015 | JPG |
| Graph 6. Age distribution of the population in the capital City of Prague as at 31 December 2005 and 2015 | JPG |
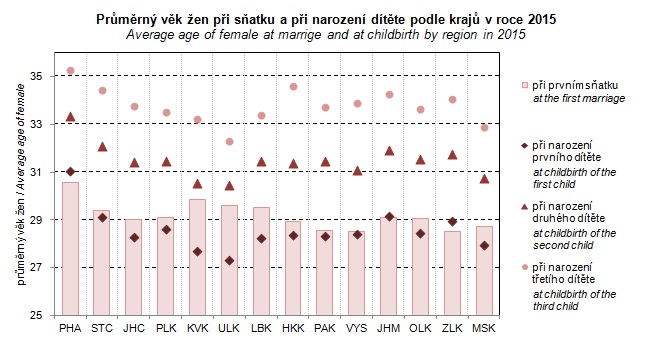
| Graph 7. Average age of female at marriage and at childbirth by region in 2015 | JPG |
| Graph 8. Divorces by duration of marriage by region in 2015 | JPG |
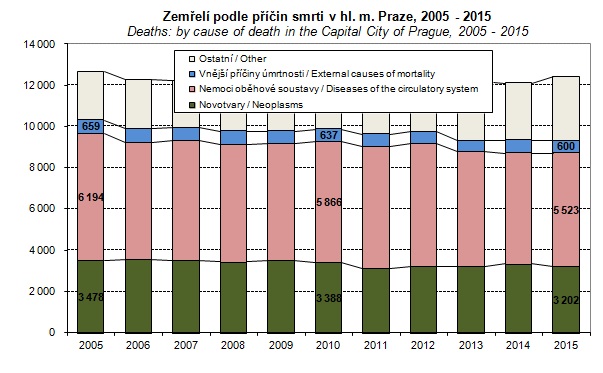
| Graph 9. Deaths in the Capital City of Prague by cause of death in 2005-2015 | JPG |
| Graph 10. Foreigners in the Capital City of Prague in 2011–2015 | JPG |
| Graph 11. Gross value added by CZ-NACE | JPG |
| Graph 12. Net disposable income of households per capita by region | JPG |
| Graph 13. Revenue and expenditure of local budgets in the Capital City of Prague | JPG |
| Graph 14. Local budget expenditure in the Capital City of Prague | JPG |
| Graph 15. Average monthly gross wages (full-time equivalent) - workplace method | JPG |
| Graph 16. Share of the unemployed persons in the Capital City of Prague (by the end of month) | JPG |
| Graph 17. Share of unemployed persons (%) and number of job applicants per 1 vacancy, by Region, as at 31 December 2015 | JPG |
| Graph 18. Businesses per 1 000 population by region as at 31 December 2015 | JPG |
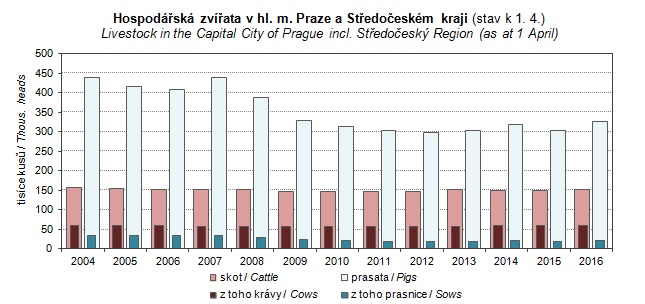
| Graph 19. Livestock in the Capital City of Prague (together with Středočeský Region, as at 1 April) | JPG |
| Graph 20. Harvest of selected farm crops in the Capital City of Prague | JPG |
| Graph 21. Sales of own goods and services incidental to industry per employee by region | JPG |
| Graph 22. Construction work according to contracts by region in 2015 | JPG |
| Graph 23. Housing construction in the Capital City of Prague | JPG |
| Graph 24. Average number of overnight stays by accommodation establishment category in 2015 | JPG |
| Graph 25. Length of roads and motorways per sq km by region as at 1 January 2016 | JPG |
| Graph 26. Households with access to a personal computer / the Internet / a broadband connection to the Internet in the Capital City of Prague | JPG |
| Graph 27. Students of public and private universities in the Capital City of Prague | JPG |
| Graph 28. Old-age pension recipients by pension amount as at December 2015 | JPG |
| Graph 29. Crime in the Capital City of Prague | JPG |
| Graph 30. Actions of Fire and Rescue Service in the Capital City of Prague | JPG |
| Graph 31. Selected indicators of the cohesion region by region in 2015 | JPG |
Published: 29.12.2016
The data are valid as of the release date of the publication.


