
Statistical Yearbook of Prague - 2014
Graphs
Attachments
| Graph 1. Selected indicators on the Capital City of Prague in comparison with the Czech Republic average in 2013 | JPG |
| Graph 2. Monthly precipitation on the territory of the Capital City of Prague in 2013 | JPG |
| Graph 3. Investment environmental protection expenditure by the investor registered office and region in 2013 | JPG |
| Graph 4. Waste management by region and by selected management method in 2013 | JPG |
| Graph 5. Waste generated by enterprises by registered and by region in 2013 | JPG |
| Graph 6. Age distribution of the population in the Capital City of Prague in 2013 and 2035 | JPG |
| Graph 7. Shares of live births in marriage and outside marriage by region in 2013 | JPG |
| Graph 8. Deaths: by cause of death in the Capital City of Prague in 2000–2013 | JPG |
| Graph 9. Foreigners in the Capital City of Prague in 2011–2013 | JPG |
| Graph 10. Gross value added by CZ-NACE | JPG |
| Graph 11. Gross fixed capital formation per capita by region (CR average=100) | JPG |
| Graph 12. Local budget expenditure in the Capital City of Prague | JPG |
| Graph 13. Average monthly gross wages (full-time equivalent) - workplace method | JPG |
| Graph 14. Share of the unemployed persons in the Capital City of Prague (by the end of month) | JPG |
| Graph 15. Share of unemployed persons (%) and number of job applicants per 1 vacancy, by Region, as at 31 December 2013 | JPG |
| Graph 16. Livestock in the Capital City of Prague incl. Středočeský Region | JPG |
| Graph 17. Average monthly gross wage per employee in industry by region | JPG |
| Graph 18. Construction work according to contracts, 2013 | JPG |
| Graph 19. Bed places in collective accommodation establishments by seasonality and region in 2013 | JPG |
| Graph 20. Students of public and private universities in the Capital City of Prague | JPG |
| Graph 21. Old-age pension recipients by pension amount as at December 2013 | JPG |
| Graph 22. Crime in the Capital City of Prague | JPG |
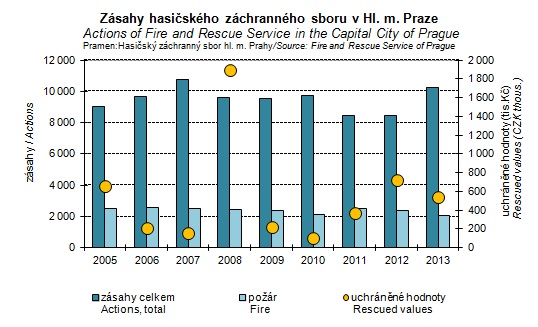
| Graph 23. Actions of Fire and Rescue Service in the Capital City of Prague | JPG |
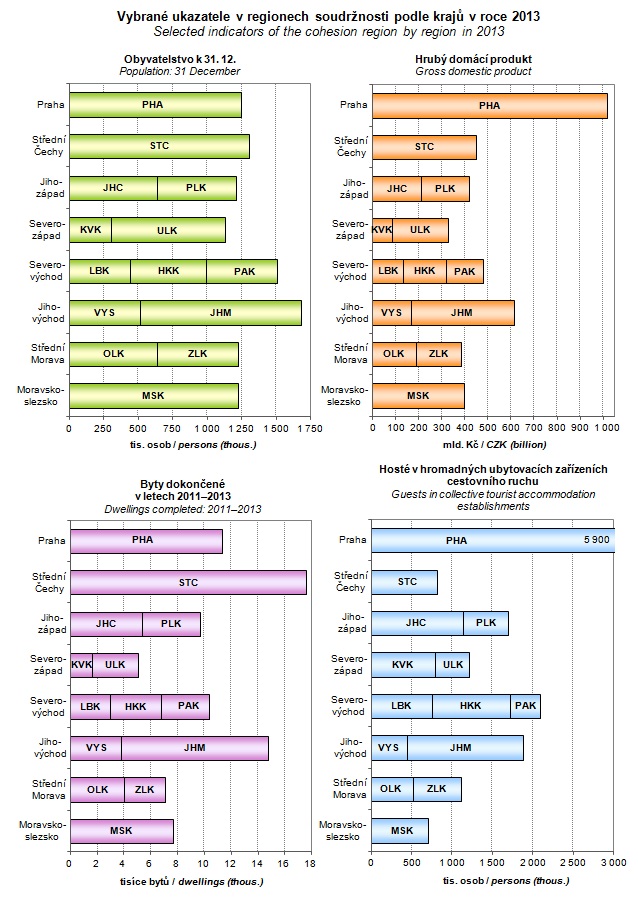
| Graph 24. Selected indicators of the cohesion region by region in 2013 | JPG |
Published: 29.12.2014
The data are valid as of the release date of the publication.


