
Statistical Yearbook of the Středočeský Region - 2014
Graphs
Attachments
| Graph 1. Selected indicators on the Středočeský Region in comparison with the Czech Republic average in 2013 | JPG |
| Graph 2. Monthly precipitation on the territory of the Středočeský Region in 2013 | JPG |
| Graph 3. Protected areas by region as at 31 December 2013 | JPG |
| Graph 4. Environmental protection investments by region of the investor registered office in 2013 | JPG |
| Graph 5. Waste management methods by enterprise registered office in 2013 | JPG |
| Graph 6. Waste generated by enterprises by registered in 2013 | JPG |
| Graph 7. Age distribution of the population in the Středočeský Region in 2013 and 2035 | JPG |
| Graph 8. Foreigners in the Středočeský Region in 2011–2013 | JPG |
| Graph 9. Gross value added by CZ-NACE in 1995 and 2013 | JPG |
| Graph 10. Gross domestic product per capita (CR average=100) by region in 2011–2013 | JPG |
| Graph 11. Local budget expenditure in the Středočeský Region in 2003–2013 | JPG |
| Graph 12. Average monthly gross wages (full-time equivalent) - workplace method in 2000–2013 | JPG |
| Graph 13. Share of unemployed persons (%) and number of job applicants per 1 vacancy, by region, as at 31 December 2013 | JPG |
| Graph 14.Share of the unemployed persons in 2011–2013 (by the end of month) | JPG |
| Graph 15. Livestock in the Středočeský Region in 2003–2013 (on terms of the surveys) | JPG |
| Graph 16. Average monthly gross wage per employee in industry by region in 2011-2013 | JPG |
| Graph 17. Construction work according to contracts by region in 2013 | JPG |
| Graph 18. Housing construction in the Středočeský Region in 2003–2013 | JPG |
| Graph 19. Bed places in collective accommodation establishments by seasonality and region in 2013 | JPG |
| Graph 20. Information technology in households by region in 2008 and 2013 | JPG |
| Graph 21. Students of public and private universities in the Středočeský Region in 2001–2013 | JPG |
| Graph 22. Old-age pension recipients by pension amount as at December 2013 | JPG |
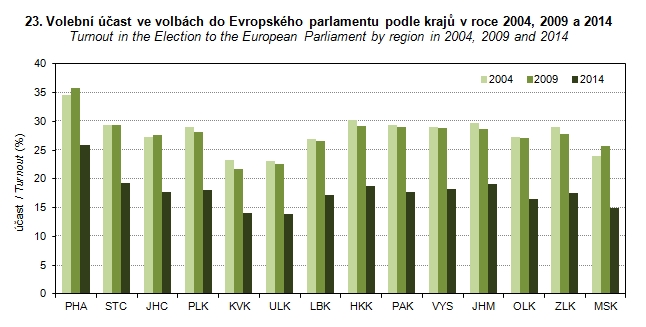
| Graph 23. Turnout in the Election to the European Parliament by region in 2004, 2009 and 2014 | JPG |
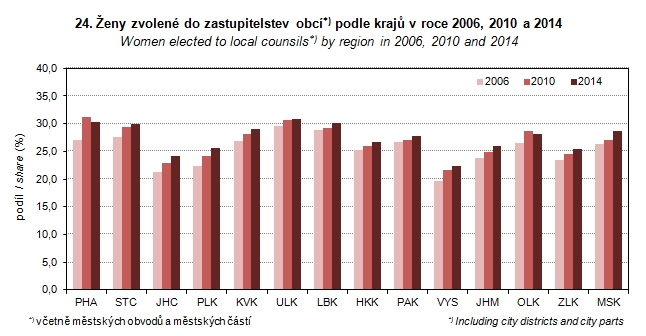
| Graph 24. Women elected to local counsils by region in 2006, 2010 and 2014 | JPG |
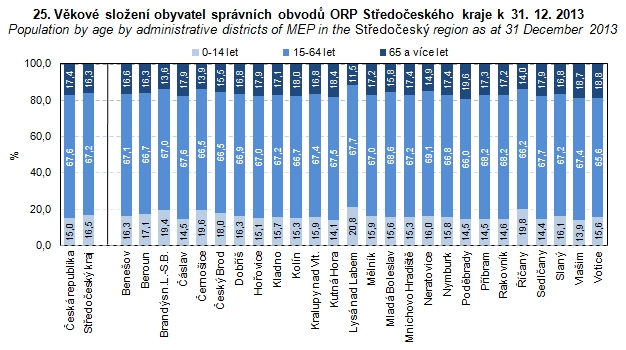
| Graph 25. Population by age by administrative districts of MEP in the Středočeský Region as at 31 December 2013 | JPG |
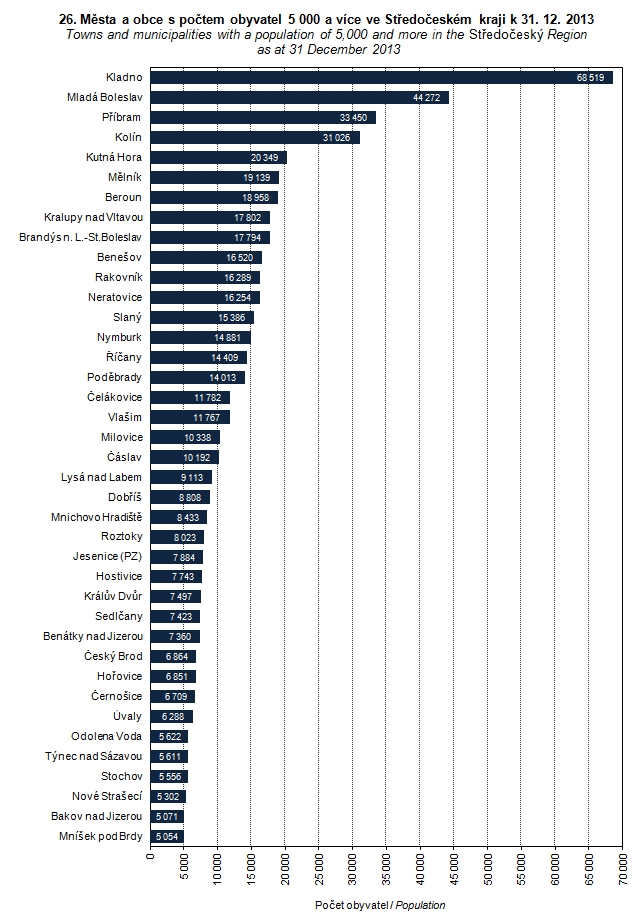
| Graph 26. Towns and municipalities with a population of 5,000 and more in the Středočeský Region as at 31 December 2013 | JPG |
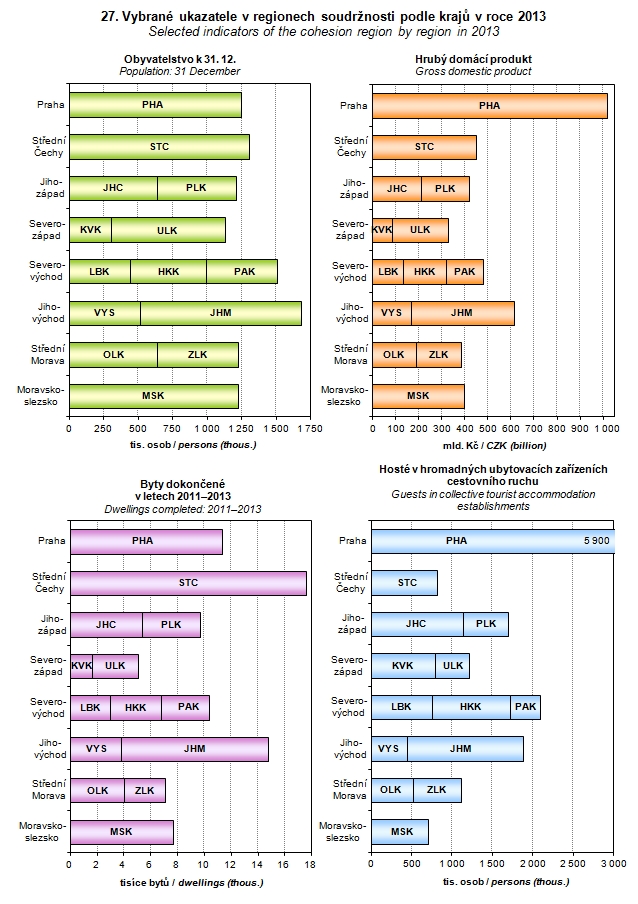
| Graph 27. Selected indicators of the cohesion region by region in 2013 | JPG |
Published: 29.12.2014
The data are valid as of the release date of the publication.


