
Statistical Yearbook of the Karlovarský Region - 2019
Graphs
Attachments
| Graph 1. Selected indicators in the Karlovarský Region in comparison with the Czech Republic average in 2018 | PNG |
| Graph 2. Monthly precipitation on the territory of the Karlovarský Region by month in 2018 | PNG |
| Graph 3. Average annual air temperature by region in 2018 | PNG |
| Graph 4. Environmental protection investments by region of the investor registered office in 2018 | PNG |
| Graph 5. Specific emissions of main pollutants into air by region in 2017 | PNG |
| Graph 6. Waste generated by enterprises by region registered in 2018 | PNG |
| Graph 7. Wastewater treatment sludge disposal method by region in 2018 | PNG |
| Graph 8. Amount of wastewater discharged and treated by region in 2018 | PNG |
| Graph 9. Age distribution of the population in the Karlovarský Region as at 31 December 2008 and 2018 | PNG |
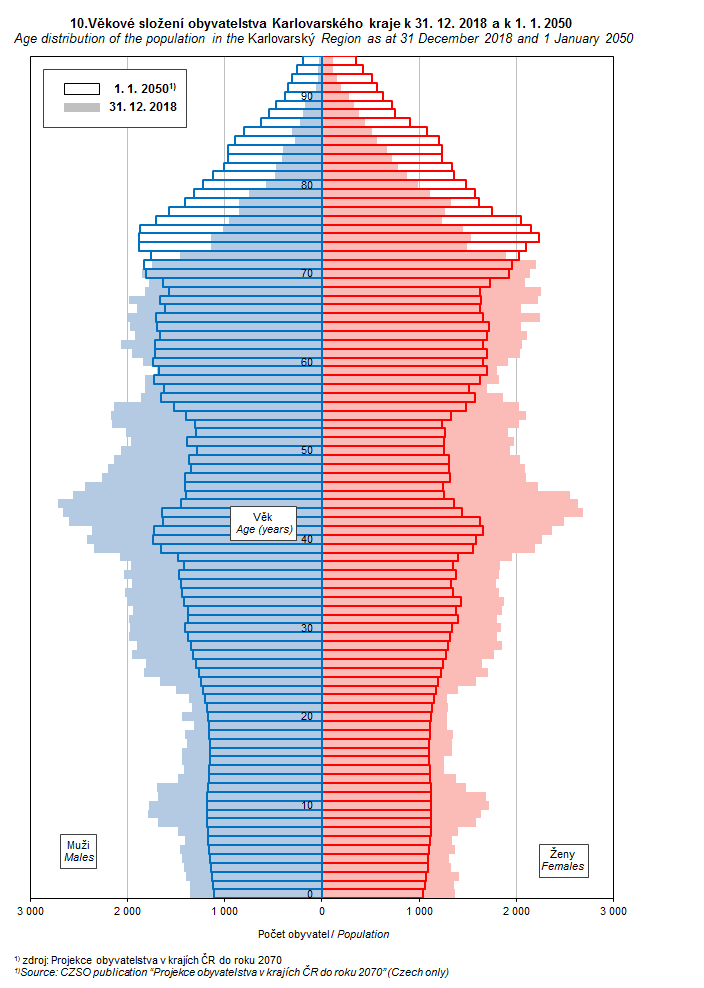
| Graph 10. Age distribution of the population in the Karlovarský Region as at 31 December 2018 and 2050 | PNG |
| Graph 11. Foreigners in the Karlovarský Region | PNG |
| Graph 12. Gross value added by CZ-NACE | PNG |
| Graph 13. Net disposable income of households per capita by region | PNG |
| Graph 14. Revenue and expenditure of local government budgets in the Karlovarský Region | PNG |
| Graph 15. Revenue-expenditure balance of local government budgets in the Karlovarský Region | PNG |
| Graph 16. Revenue-expenditure balance local government budgets by region | PNG |
| Graph 17. Average gross monthly wages per employee | PNG |
| Graph 18. Share of the unemployed persons (as at the end of respective month) | PNG |
| Graph 19. Share of the unemployed persons and the number of job applicants kept in the labour office register per job vacancy kept in the labour office register by region as at 31 December 2018 | PNG |
| Graph 20. Births and deaths of businesses by region in 2018 | PNG |
| Graph 21. Natural persons and legal persons by region as at 31 December 2018 | PNG |
| Graph 22. Harvest of selected crops in the Karlovarský Region | PNG |
| Graph 23. Livestock in the Karlovarský Region as at 1 April of the reference year | PNG |
| Graph 24. Livestock by region as at 1 April 2019 | PNG |
| Graph 25. Consumption of mineral fertilisers by region in the crop year 2017/2018 | PNG |
| Graph 26. Output of the agricultural industry per hectare of utilised agricultural land by region | PNG |
| Graph 27. Roundwood removals in the Karlovarský Region | PNG |
| Graph 28. Wild boar shot by region | PNG |
| Graph 29. Sales of goods and services incidental to industry per employee by region | PNG |
| Graph 30. Consumption of electricity per capita in households by region in 2018 | PNG |
| Graph 31. Average annual expenditure for electricity and gas per household by region | PNG |
| Graph 32. Construction work ˝S˝ implemented in the Karlovarský Region | PNG |
| Graph 33. Construction work ˝S˝ in the CR by region in 2018 | PNG |
| Graph 34. Housing construction in the Karlovarský Region | PNG |
| Graph 35. Guests (residents, non-residents) in collective accommodation establishments by region | PNG |
| Graph 36. Collective accommodation establishments by number of beds and by region in 2018 | PNG |
| Graph 37. Density of roads and motorways per square kilometre by region as at 1 January 2019 | PNG |
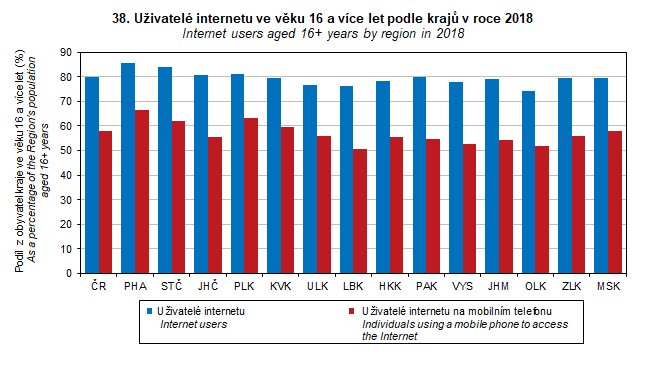
| Graph 38. Internet users aged 16+ years by region in 2018 | PNG |
| Graph 38. Internet users aged 16+ years by region in 2018 | PNG |
| Graph 39. Temporary incapacity for work due to disease or injury by region in 2018 | PNG |
| Graph 40. Beds in selected residential social service establishments in the Karlovarský Region | PNG |
| Graph 41. Public libraries in the Karlovarský Region | PNG |
| Graph 42. Traffic accidents by main cause and region in 2018 | PNG |
| Graph 43. Turnout in the elections to the European Parliament by region | PNG |
| Graph 44. Turnout by type of elections and region | PNG |
| Graph 45. Job applicants kept in the labour office register by age and administrative district of MEP in the Karlovarský Region as at 31 December | PNG |
| Graph 46. Average age by administrative district of MEP in the Karlovarský Region as at 31 December 2018 | PNG |
| Graph 47. Selected indicators in cohesion regions by region in 2018 | PNG |
Published: 19.12.2019
The data are valid as of the release date of the publication.


