
Statistical Yearbook of Prague - 2017
Graphs
Attachments
| Graph 1. Selected indicators on the Capital City of Prague in comparison with the Czech Republic average in 2016 | PNG |
| Graph 2. Monthly precipitation on the territory of the Capital City of Prague in 2016 | PNG |
| Graph 3. Average annual air temperature by region in 2016 | PNG |
| Graph 4. Emissions of main pollutants into air in 2015 | PNG |
| Graph 5. Environmental protection investments by region of the investor registered office in 2016 | PNG |
| Graph 6. Wastewater treatment sludge production and sludge disposal by region in 2016 | PNG |
| Graph 7. Amount of wastewater discharged and treated by region in 2016 | PNG |
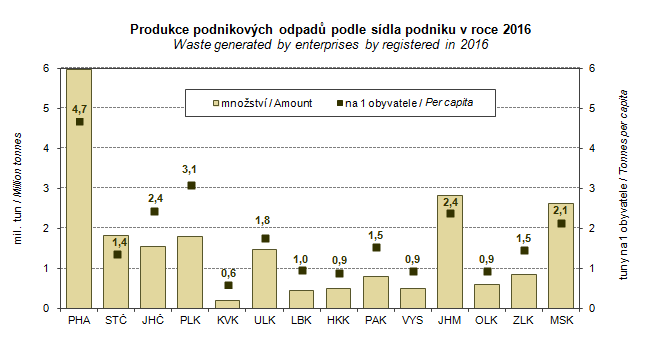
| Graph 8. Waste generated by enterprises by registered office in 2016 | PNG |
| Graph 9. Age distribution of the population in the Capital City of Prague as at 31 December 2006 and 2016 | PNG |
| Graph 10. Live births within marriage and outside marriage in the Capital City of Prague | PNG |
| Graph 11. Deaths: by cause of death in the Capital City of Prague, 2006 - 2016 | PNG |
| Graph 12. Foreigners in the Capital City of Prague in 2012–2016 | PNG |
| Graph 13. Gross value added by CZ-NACE | PNG |
| Graph 14. Net disposable income of households per capita | PNG |
| Graph 15. Revenue-expenditure balance local government budgets | PNG |
| Graph 16. Revenue and expenditure of local government budgets in the Capital City of Prague | PNG |
| Graph 17. Local government budget expenditure in the Capital City of Prague | PNG |
| Graph 18. Revenue-expenditure balance local goverment budgets in the Capital City of Prague | PNG |
| Graph 19. Average monthly gross wages (full-time equivalent) - workplace method | PNG |
| Graph 20. Share of the unemployed persons in the Capital City of Prague (by the end of month) | PNG |
| Graph 21. Share of unemployed persons (%) and number of job applicants per 1 job vacancy, by Region, as at 31 December 2016 | PNG |
| Graph 22. Businesses per 1 000 population aged 18+ years by region as at 31 December 2016 | PNG |
| Graph 23. Births and deaths of businesses by region in 2016 | PNG |
| Graph 24. Agricultural output per hectare of utilised agricultural area by region | PNG |
| Graph 25. Harvest of selected crops in the Capital City of Prague | PNG |
| Graph 26. Livestock in the Capital City of Prague and the Středočeský Region as at 1 April of the reference year | PNG |
| Graph 27. Consumption of mineral fertilisers by region in the crop year 2015/2016 | PNG |
| Graph 28. Roundwood removals in the Capital City of Prague | PNG |
| Graph 29. Sales of goods and services incidental to industry per employee by region | PNG |
| Graph 30. Dwellings by type of house insulation and by region | PNG |
| Graph 31. Average annual expenditure of households for electricity and natural gas by region | PNG |
| Graph 32. Housing construction in the Capital City of Prague | PNG |
| Graph 33. Construction work "S" in the CR by region in 2016 | PNG |
| Graph 34. Collective accommodation establishments by number of beds and by region in 2016 | PNG |
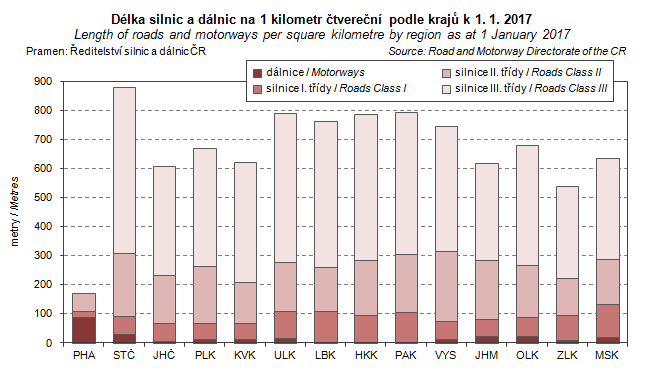
| Graph 35. Length of roads and motorways per square kilometre by region as at 1 January 2017 | PNG |
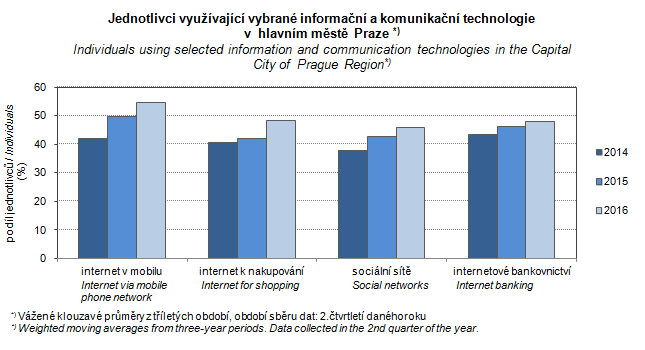
| Graph 36. Individuals using selected information and communication technologies in the Capital City of Prague | PNG |
| Graph 37. Students in public and private universities in the Capital City of Prague | PNG |
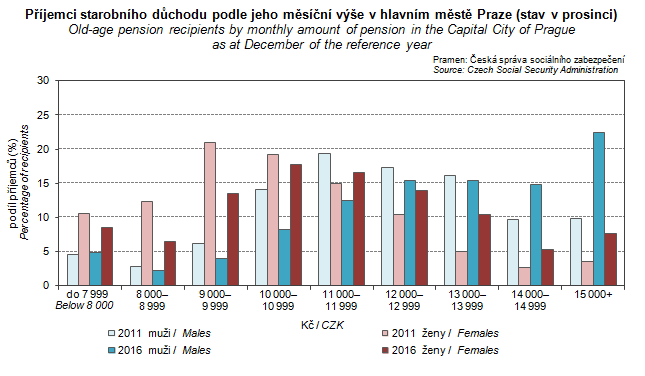
| Graph 38. Old-age pension recipients by pension monthly amount in the Capital City of Prague (as at December) | PNG |
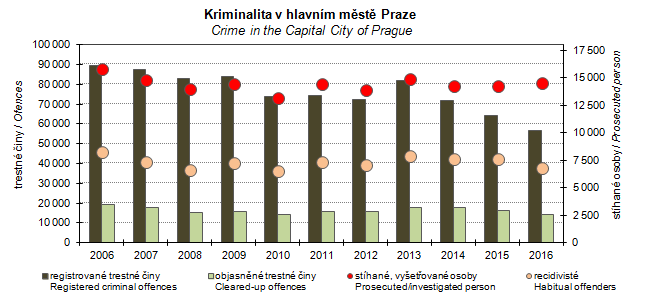
| Graph 39. Crime in the Capital City of Prague | PNG |
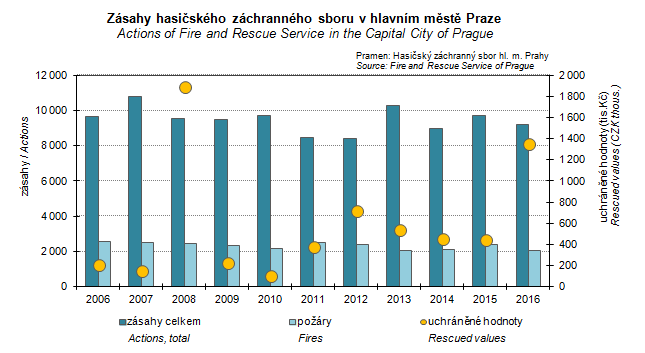
| Graph 40. Actions of Fire and Rescue Service in the Capital City of Prague | PNG |
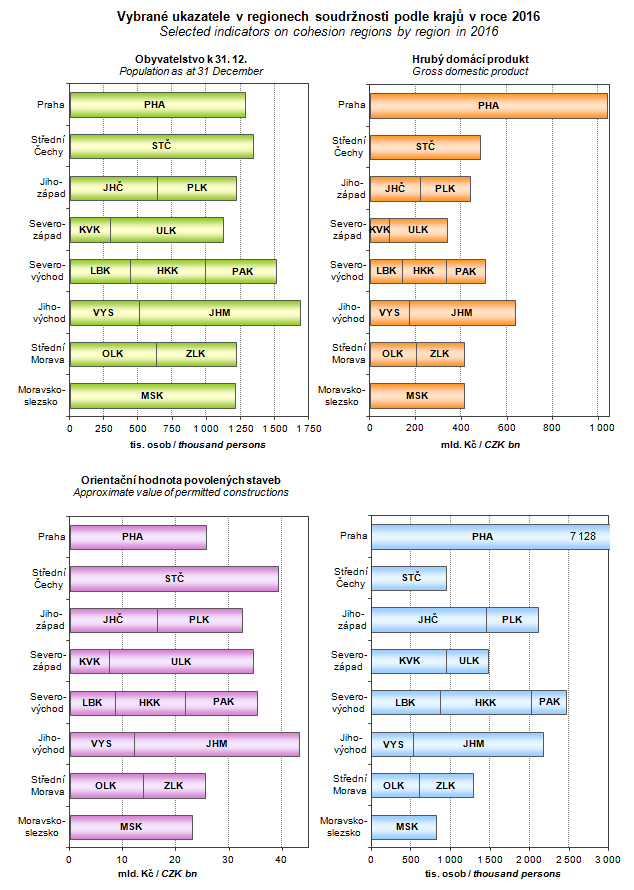
| Graph 41. Selected indicators on cohesion regions by region in 2016 | PNG |
Published: 28.12.2017
The data are valid as of the release date of the publication.


