
Statistical Yearbook of the Olomoucký Region - 2017
Graphs
Attachments
| Graph 1. Selected indicators on the Olomoucký Region in comparison with the Czech Republic average in 2016 | PNG |
| Graph 2. Monthly precipitation on the weather station Olomouc in 2013–2016 | PNG |
| Graph 3. Average annual air temperature by region in 2016 | PNG |
| Graph 4. Emissions of main pollutants into air in 2015 | PNG |
| Graph 5. Environmental protection investments by region of the investor registered office in 2016 | PNG |
| Graph 6. Waste generated by enterprises by registered in 2016 | PNG |
| Graph 7. Wastewater treatment sludge production and sludge disposal by region in 2016 | PNG |
| Graph 8. Amount of wastewater discharged and treated by region in 2016 | PNG |
| Graph 9. Age distribution of the population in the Olomoucký Region as at 31 December 2006 and 2016 | PNG |
| Graph 10. Live births within marriage and outside marriage in the Olomoucký Region | PNG |
| Graph 11. Foreigners in the Olomoucký Region (as at 31 December) | PNG |
| Graph 12. Gross value added by CZ-NACE | PNG |
| Graph 13. Net disposable income of households per capita | PNG |
| Graph 14. Revenue and expenditure of local goverment budgets in the Olomoucký Region | PNG |
| Graph 15. Local goverment budget expenditure in the Olomoucký Region | PNG |
| Graph 16. Revenue-expenditure balance of local goverment budgets in the Olomoucký Region | PNG |
| Graph 17. Average gross monthly wages (full-time equivalent employees) by the workplace method | PNG |
| Graph 18. Share of the unemployed persons in the Olomoucký Region (as at the end of respective month) | PNG |
| Graph 19. Share of unemployed persons and the number of job applicants kept in the labour office register per job vacancy kept in the labour office register by region as at 31 December 2016 | PNG |
| Graph 20. Businesses per 1 000 population aged 18+ years by region as at 31 December 2016 | PNG |
| Graph 21. Births and deaths of businesses by region in 2016 | PNG |
| Graph 22. Agricultural output per hectare of utilised agricultural area by region | PNG |
| Graph 23. Harvest of selected crops in the Olomoucký Region | PNG |
| Graph 24. Livestock in the Olomoucký Region as at 1 April of the reference year | PNG |
| Graph 25. Consumption of mineral fertilisers by region in the crop year 2015/2016 | PNG |
| Graph 26. Roundwood removals in the Olomoucký Region | PNG |
| Graph 27. Sales of goods and services incidental to industry per employee by region | PNG |
| Graph 28. Dwellings by type of house insulation and by region | PNG |
| Graph 29. Average annual expenditure of households for electricity and natural gas by region | PNG |
| Graph 30. Construction work "S" in the CR by region in 2016 | PNG |
| Graph 31. Housing construction in the Olomoucký Region | PNG |
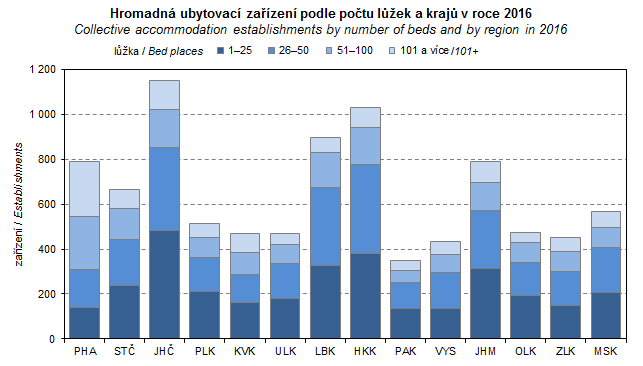
| Graph 32. Collective accommodation establishments by number of beds and by region in 2016 | PNG |
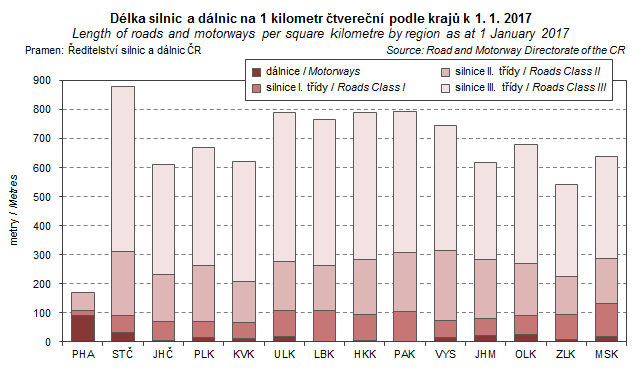
| Graph 33. Length of roads and motorways per square kilometre by region as at 1 January 2017 | PNG |
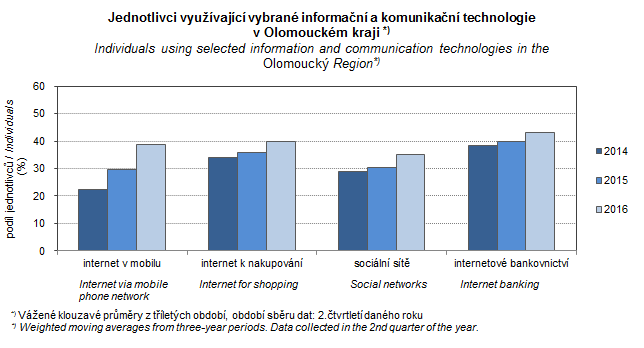
| Graph 34. Individuals using selected information and communication technologies in the Olomoucký Region | PNG |
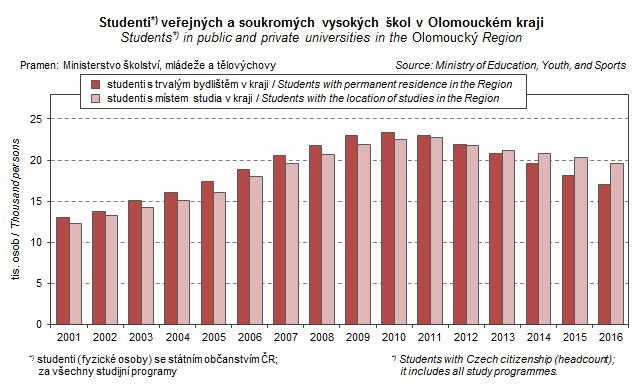
| Graph 35. Students in public and private universities in the Olomoucký Region | PNG |
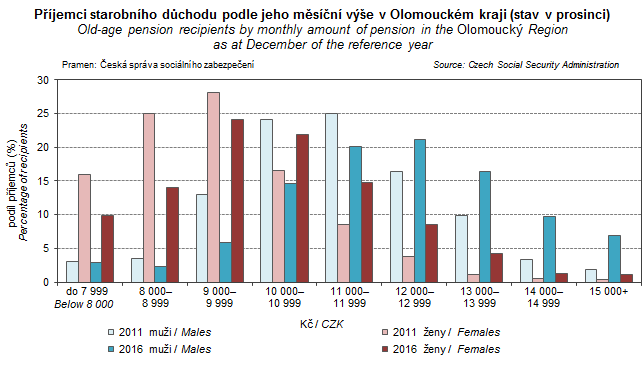
| Graph 36. Old-age pension recipients by monthly amount of pension in the Olomoucký Region as at December of the reference year | PNG |
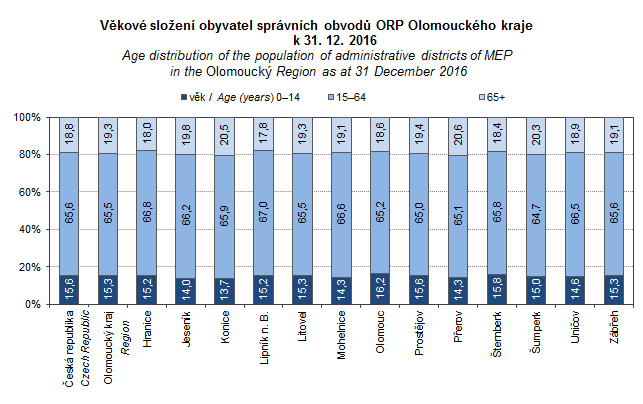
| Graph 37. Age distribution of the population of administrative districts of MEP in the Olomoucký Region as at 31 December 2016 | PNG |
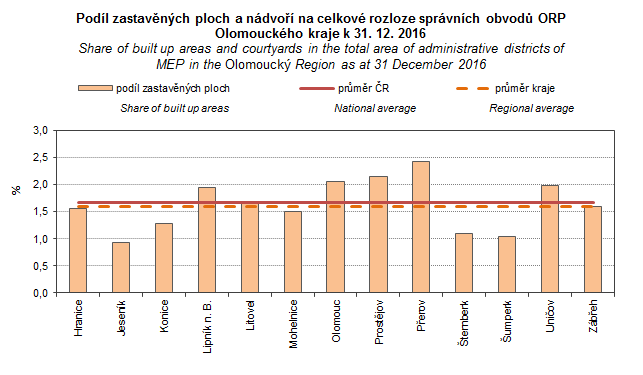
| Graph 38. Share of built up areas and courtyards in the total area of administrative districts of MEP in the Olomoucký Region as at 31 December 2016 | PNG |
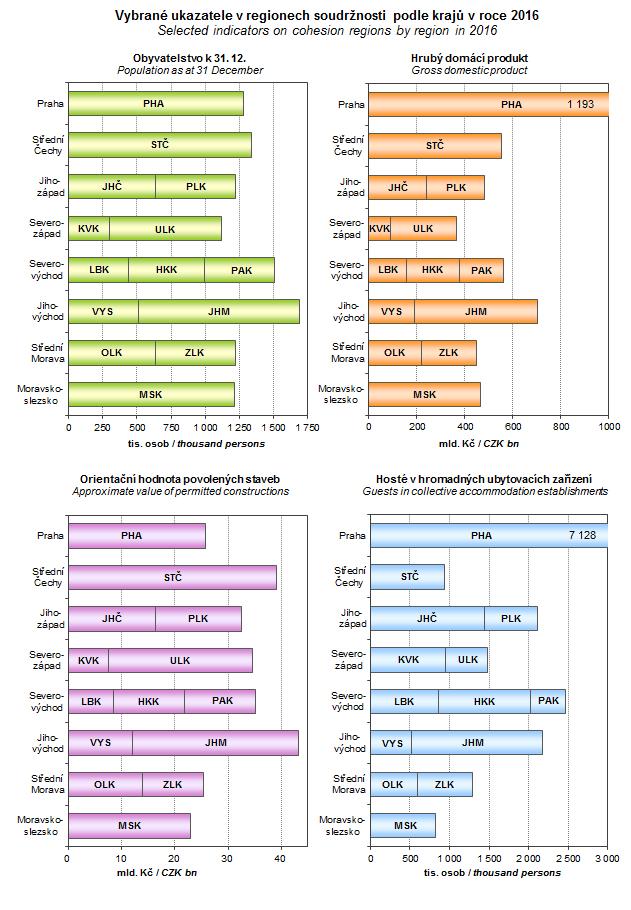
| Graph 39. Selected indicators on cohesion regions by region in 2016 | PNG |
Published: 28.12.2017
The data are valid as of the release date of the publication.


