
Comparison of Regions in the Czech Republic - 2017
Graphs
Attachments
| Average annual air temperature by region in 2016 | PNG |
| Emissions of main pollutants into air in 2015 | PNG |
| Waste generated by enterprises by registered in 2016 | PNG |
| Amount of wastewater discharged and treated by region in 2016 | PNG |
| Wastewater treatment sludge production and sludge disposal by region in 2016 | PNG |
| Environmental protection investments by region of the investor registered office in 2016 | PNG |
| Net disposable income of households per capita | PNG |
| Revenue-expenditure balance local goverment budgets | PNG |
| Share of unemployed persons and the number of job applicants kept in the labour office register per job vacancy kept in the labour office register by region as at 31 December 2016 | PNG |
| Businesses per 1 000 population aged 18+ years by region as at 31 December 2016 | PNG |
| Births and deaths of businesses by region in 2016 | PNG |
| Agricultural output per hectare of utilised agricultural area by region | PNG |
| Livestock by region as at 1 April 2017 | PNG |
| Consumption of mineral fertilisers by region in the crop year 2015/2016 | PNG |
| Sales of goods and services incidental to industry per employee by region | PNG |
| Dwellings by type of house insulation and by region | PNG |
| Average annual expenditure of households for electricity and natural gas by region | PNG |
| Construction work "S" in the CR by region in 2016 | PNG |
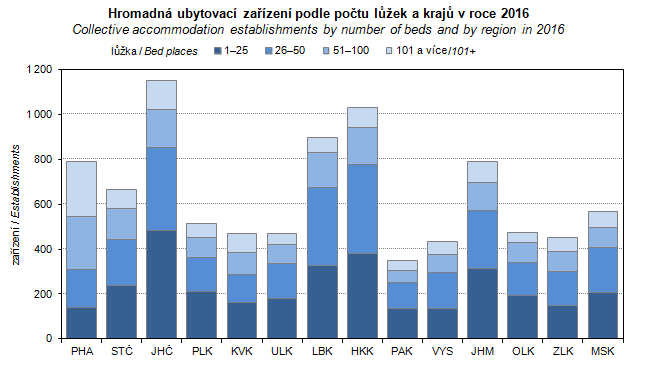
| Collective accommodation establishments by number of beds and by region in 2016 | PNG |
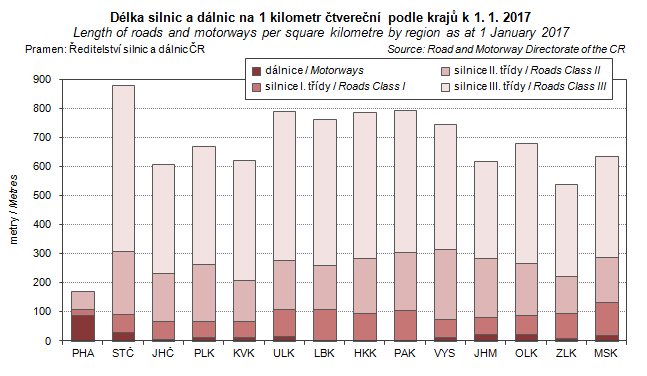
| Length of roads and motorways per square kilometre by region as at 1 January 2017 | PNG |
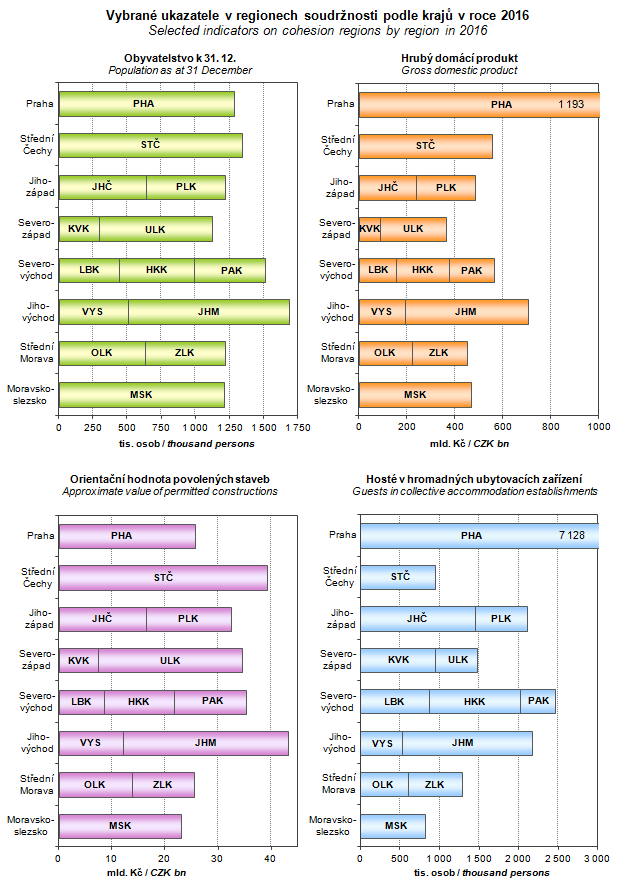
| Selected indicators on cohesion regions by region in 2016 | PNG |
Published: 16.01.2018
The data are valid as of the release date of the publication.


