
Statistical Yearbook of the Vysočina Region - 2018
Graphs
Attachments
| Graph 1. Selected indicators in the Vysočina Region in comparison with the Czech Republic average in 2017 | PNG |
| Graph 2. Monthly precipitation on the territory of the Vysočina Region by month in 2017 | PNG |
| Graph 3. Average annual air temperature by region in 2017 | PNG |
| Graph 4. Specific emissions of main pollutants into air by region in 2016 | PNG |
| Graph 5. Environmental protection investments by region of the investor registered office in 2017 | PNG |
| Graph 6. Wastewater treatment sludge disposal method by region in 2017 | PNG |
| Graph 7. Amount of wastewater discharged and treated by region in 2017 | PNG |
| Graph 8. Waste generated by enterprises by registered in 2017 | PNG |
| Graph 9. Population change by region in 2017 (per 1 000 mid-year population) | PNG |
| Graph 10. Live births by age of mother in the Vysočina Region | PNG |
| Graph 11. Deaths by cause of death in the Vysočina Region | PNG |
| Graph 12. Age distribution of the population in the Vysočina Region as at 31 December 2007 and 2017 | PNG |
| Graph 13. Foreigners in the Vysočina Region in 2012–2017 | PNG |
| Graph 14. Gross value added by CZ-NACE | PNG |
| Graph 15. Gross domestic product per the employed by region | PNG |
| Graph 16. Revenue and expenditure of local government budgets in the Vysočina Region | PNG |
| Graph 17. Local government budget expenditure in the Vysočina Region | PNG |
| Graph 18. Revenue-expenditure balance of local government budgets in the Vysočina Region | PNG |
| Graph 19. Revenue-expenditure balance local government budgets by region | PNG |
| Graph 20. Average gross monthly wages per emloyee | PNG |
| Graph 21. Share of the unemployed persons in the Vysočina Region (as at the end of respective month) | PNG |
| Graph 22. Percentage of unemployed persons and the number of job applicants kept in the labour office register per job vacancy kept in the labour office register by region as at 31 December 2017 | PNG |
| Graph 23. Natural persons and legal persons by region as at 31 December 2017 | PNG |
| Graph 24. Births and deaths of businesses by region in 2017 | PNG |
| Graph 25. Harvest of selected crops in the Vysočina Region | PNG |
| Graph 26. Livestock in the Vysočina Region as at 1 April of the reference year | PNG |
| Graph 27. Livestock by region as at 1 April 2018 | PNG |
| Graph 28. Consumption of mineral fertilisers by region in the crop year 2016/2017 | PNG |
| Graph 29. Areas of orchards by fruit tree species as at 1 May 2017 | PNG |
| Graph 30. Roundwood removals in the Vysočina Region | PNG |
| Graph 31. Wild boar shot by region | PNG |
| Graph 32. Sales of goods and services incidental to industry per employee by region | PNG |
| Graph 33. Consumption of natural gas in households by region in 2017 | PNG |
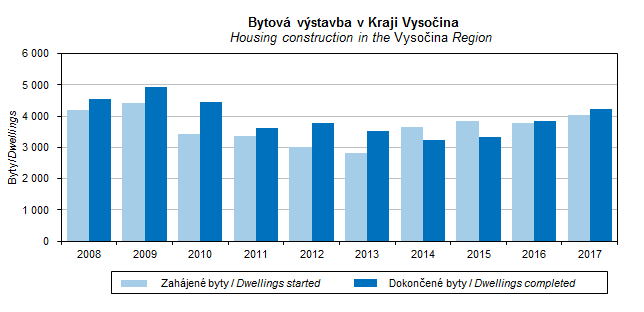
| Graph 34. Housing construction in the Vysočina Region | PNG |
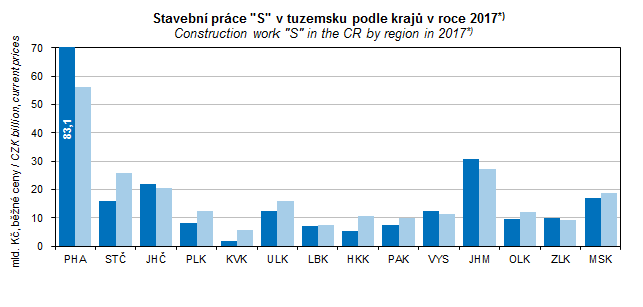
| Graph 35. Construction work "S" in the CR by region in 2017 | PNG |
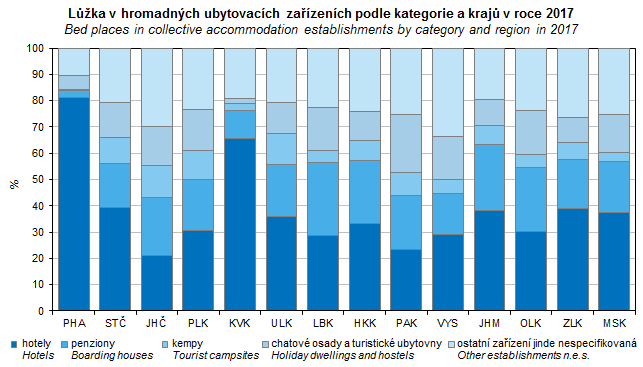
| Graph 36. Bed places in collective accommodation establishments by category and region in 2017 | PNG |
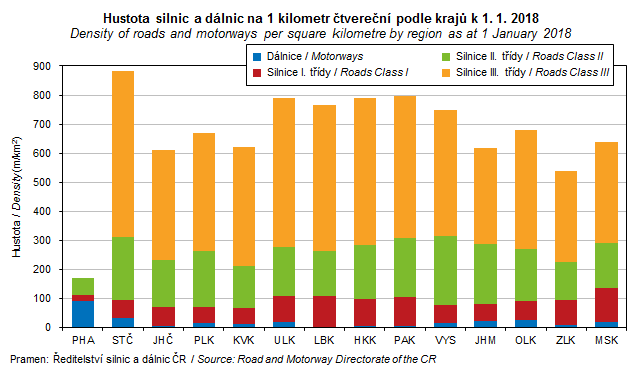
| Graph 37. Density of roads and motorways per square kilometre by region as at 1 January 2018 | PNG |
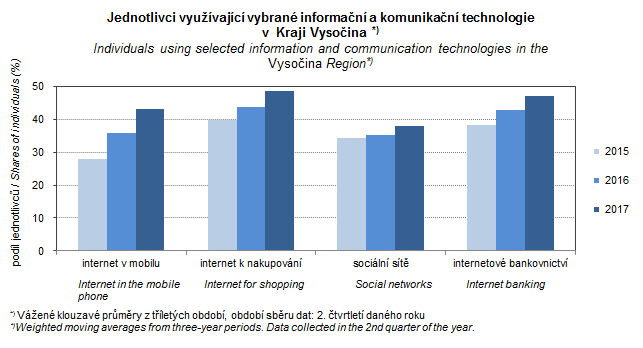
| Graph 38. Individuals using selected information and communication technologies in the Vysočina Region | PNG |
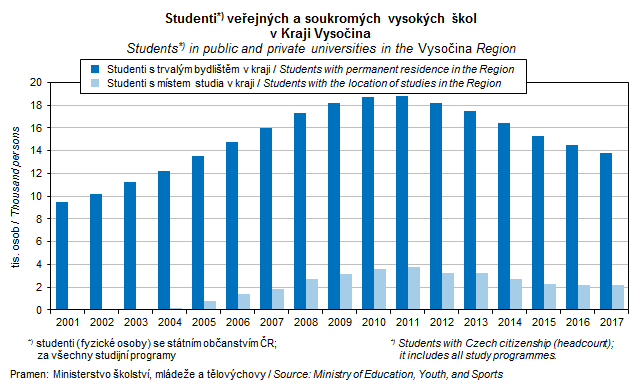
| Graph 39. Students in public and private universities in the Vysočina Region | PNG |
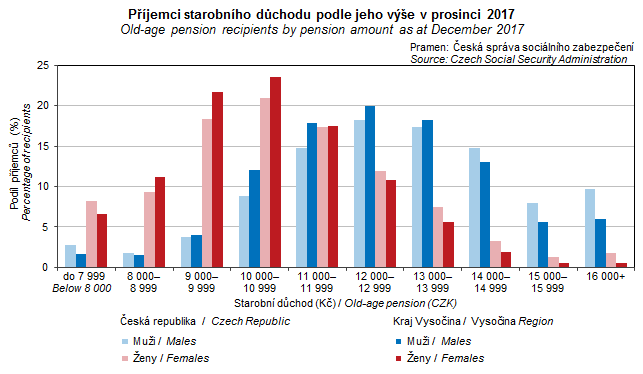
| Graph 40. Old-age pension recipients by pension monthly amount as at December 2017 | PNG |
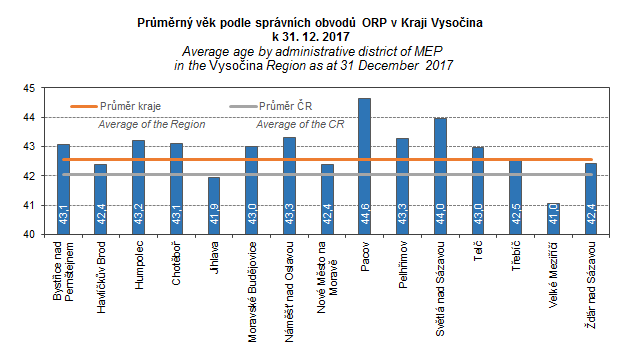
| Graph 41. Average age by administrative district of MEP in the Vysočina Region as at 31 December 2017 | PNG |
| Graph 42. Ageing index (pop. 65+/pop. 0–14) by administrative district of MEP in the Vysočina Region as at 31 December 2017 | PNG |
| Graph 43. Structure of agricultural land by administrative district of MEP in the Vysočina Region as at 31 December 2017 | PNG |
| Graph 44. Structure of non-agricultural land by administrative districts of MEP in the Vysočina Region as at 31 December 2017 | PNG |
| Graph 45. Selected indicators on cohesion regions by region in 2017 | PNG |
Published: 28.12.2018
The data are valid as of the release date of the publication.


