
Statistical Yearbook of the Liberecký Region - 2015
Graphs
Attachments
| Graph 1. Selected indicators on the Liberecký Region in comparison with the Czech Republic average in 2014 | PNG |
| Graph 2. Monthly precipitation on the territory of the Liberecký Region in 2014 | PNG |
| Graph 3. Emissions of main pollutants into air in 2013 | PNG |
| Graph 4. Environmental protection investments by region of the investor registered office in 2014 | PNG |
| Graph 5. Waste management methods by enterprise registered office in 2014 | PNG |
| Graph 6. Waste generated by enterprises by registered in 2014 | PNG |
| Graph 7. Age distribution of the population in the Liberecký Region as at 31 December 2004 and 2014 | PNG |
| Graph 8. Marriages by month in the Liberecký Region | PNG |
| Graph 9. Foreigners in the Liberecký Region in 2010–2014 | PNG |
| Graph 10. Gross value added by CZ-NACE | PNG |
| Graph 11. Investment rate by region | PNG |
| Graph 12. Revenue and expenditure in the Liberecký Region | PNG |
| Graph 13. Local budget expenditure in the Liberecký Region | PNG |
| Graph 14. Average monthly gross wages (full-time equivalent)-workplace method | PNG |
| Graph 15. Share of the unemployed persons in the Liberecký Region (by the end of month) | PNG |
| Graph 16. Share of unemployed persons and number of job applicants per 1 vacancy, by Region, as at 31 December 2014 | PNG |
| Graph 17. Businesses per 1 000 population by region as at 31 December 2014 | PNG |
| Graph 18. Farming of agricultural holdings on their own utilised agricultural area by region in 2013 | PNG |
| Graph 19. Sales of own goods and services incidental to industry per employee by region | PNG |
| Graph 20. Construction work according to contracts, 2014 | PNG |
| Graph 21. Housing construction in the Liberecký region in 2005–2014 | PNG |
| Graph 22. Beds in collective accommodation establishments by reions in 2014 | PNG |
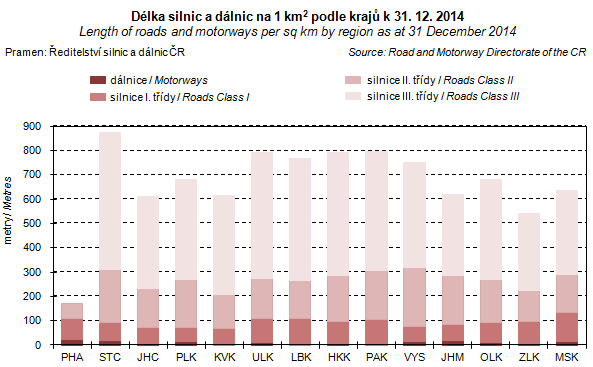
| Graph 23. Length of roads and motorways per sq km by region as at 31 December 2014 | PNG |
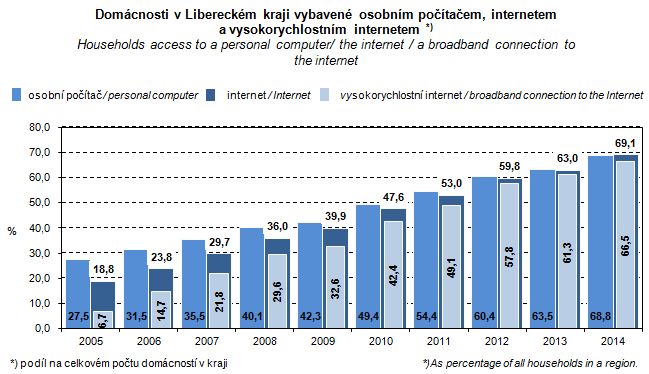
| Graph 24. Households with access to a personal computer / the Internet / a broadband connection to the Internet in the Liberecký Region | PNG |
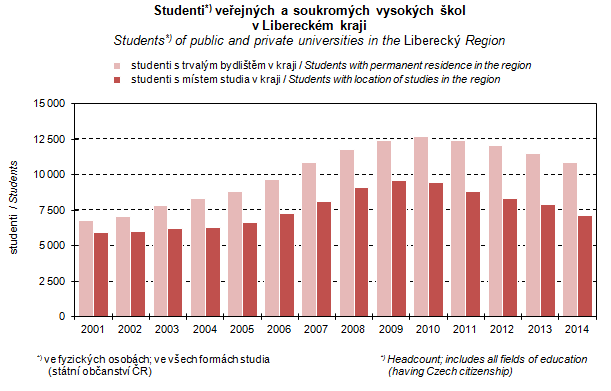
| Graph 25. Students of public and private universities in the Liberecký Region | PNG |
| Graph 26. Old-age pension recipients by pension amount as at December 2014 | PNG |
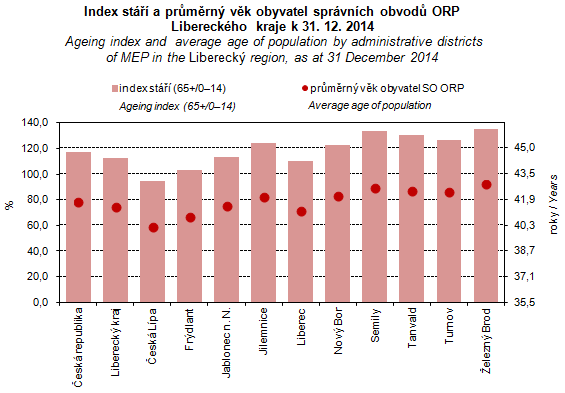
| Graph 27. Ageing index and average age of population by administrative districts of MEP in the Liberecký Region as at 31 December 2014 | PNG |
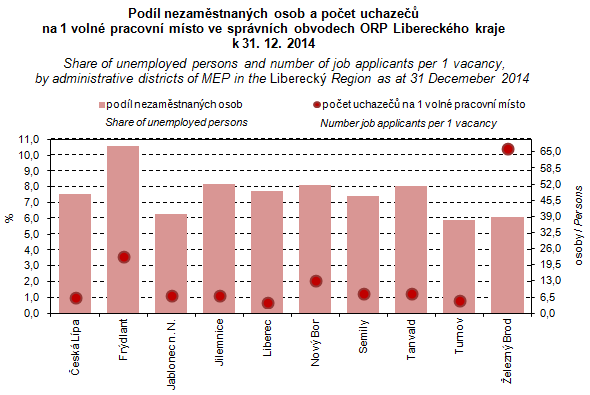
| Graph 28. Share of unemployed persons (%) and number of job applicants per 1 vacancy, by administrative districts of MEP in the Liberecký Region as at 31 December 2014 | PNG |
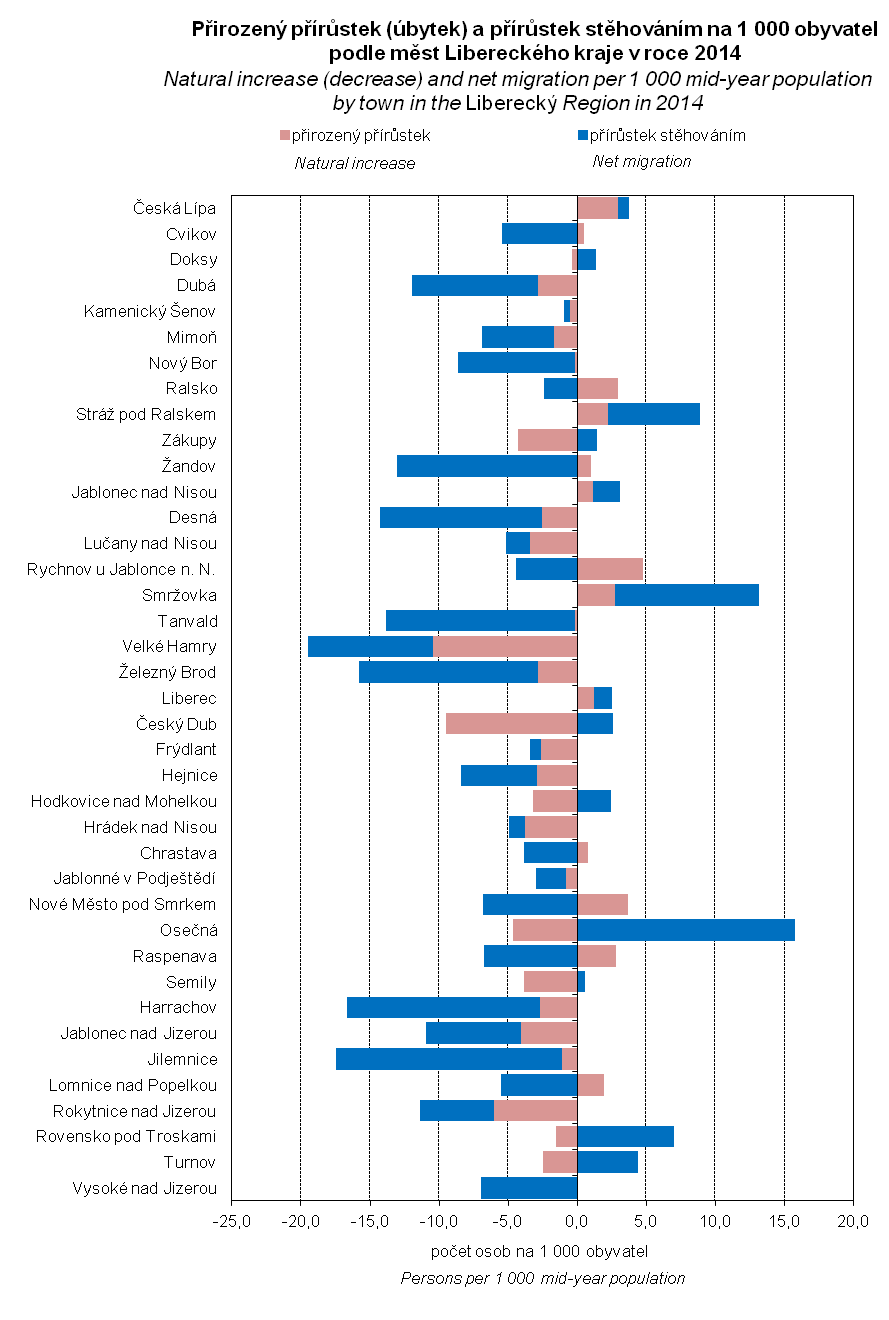
| Graph 29. Natural increase and net migration per 1 000 mid-year population by town in the Liberecký Region in 2014 | PNG |
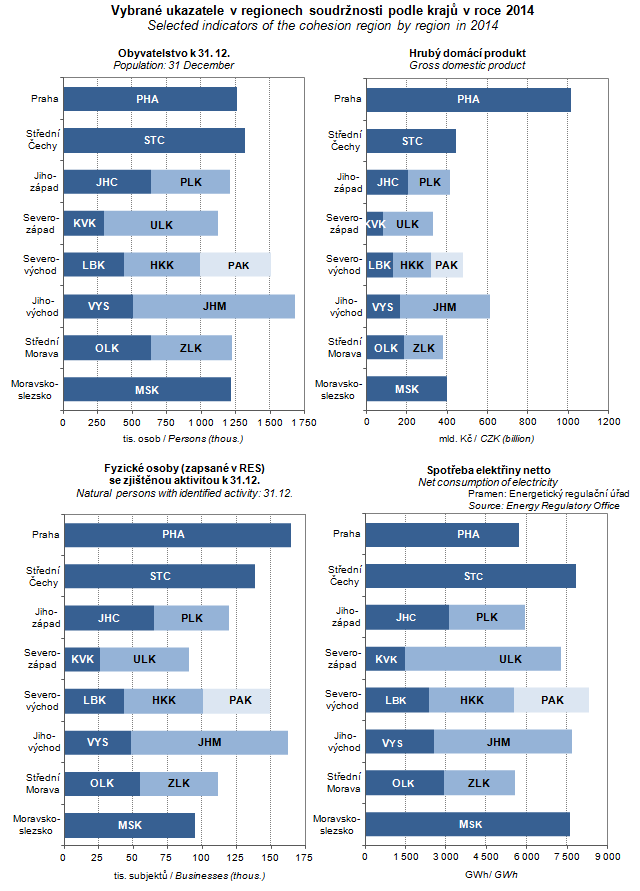
| Graph 30. Selected indicators of the cohesion region by region in 2014 | PNG |
Published: 29.12.2015
The data are valid as of the release date of the publication.


