The position of the Czech labour market in the EU - 3rd quarter 2009
05.02.2010
Code: q-3157-09
a) Employment
In the international comparison the Czech Republic still belongs to the countries with employment intensity slightly above the average. According to latest data published by Eurostat for Q3 2009, the unemployment rate for the 15-64 age group was higher than the total for the EU-27. . However, female employment rate is in the Czech Republic notably below the EU27 average while the male employment is markedly higher. Employment rate for the 15-64 age group was in the Czech Republic 65.2% (males 73.7%, females 56.5%), for the whole EU the rate was 64.8% (males 71.0% and females 58.7%).
Concrete aims for employment rate in the EU countries until 2010 were determined in the meetings of the European Council in Lisbon in 2000 and Stockholm in 2001. The total employment rate should reach at least 70%, female employment rate at least 60% and elderly employment rate (age group 55-64) at least 50%.
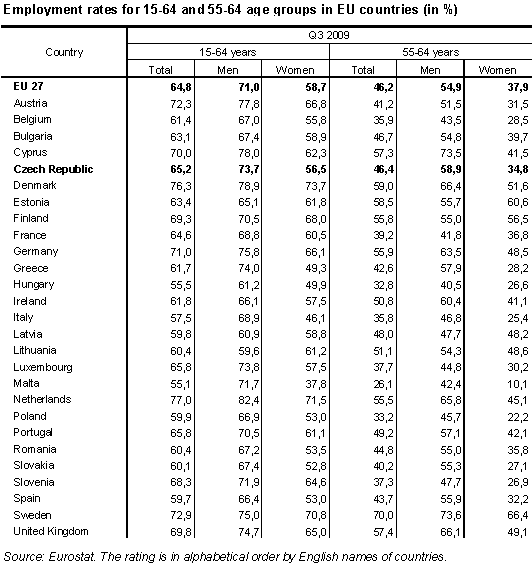
There were considerable differences in employment rates between EU countries, not only in terms of the wide age group 15-64, but also the male and female employment components. On the one hand, there is still a high employment rate in the northern countries and the Netherlands, in which it remained on the level 77.0 % even in Q3 2009); on the other hand, employment rate in some of the countries was deeply below 60% (e.g. 55.5% in Hungary and 55.1 % in Malta in Q3 2009). Comparing neighbouring countries to the Czech Republic, higher employment rates in the long term were in Austria and Germany and significantly lower was the unemployment rate in Poland and Slovakia.
Even bigger differences are in the employment rates of persons aged 55-64. In Poland, Hungary, Italy, and Belgium it was slightly above 30%. In contrast, 10 countries, including the northern countries, have already exceeded the required 50% limit. Although according to results of international comparison results the total employment is falling, the age group 15-64 does not contribute to such trend. In the long-term perspective it can be assumed that the number of countries exceeding the required 50% rate will grow. In the Czech Republic, the employment rate of this ten years age group was so far below the required level reaching 46.4%. Owing to the increasing retirement age limit employment rate of women namely in this age group is expected to grow.
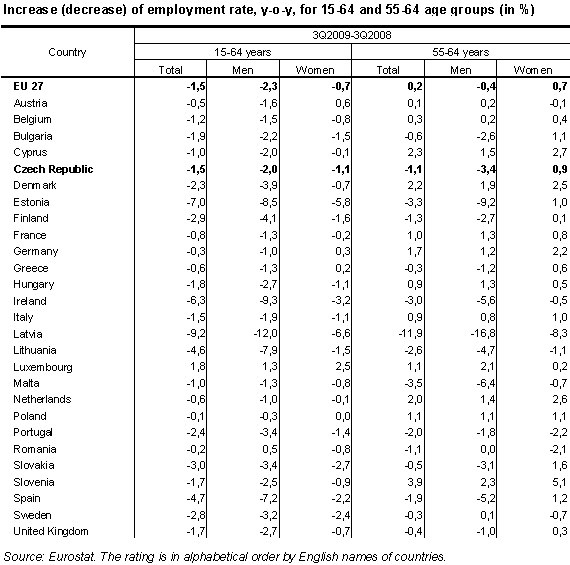
Data on employment rate show big changes in the European labour market. In prevailing majority of countries the contribution of employed persons to the total volume of the population in the productive age dropped markedly. In EU27 the employment rate of persons aged 15-64 dropped, y-o-y, by 1.5 percentage point. An exceptional big decrease of employment recorded all three Baltic countries, i.e. Latvia, Lithuania and Estonia, also Spain and Ireland. Among these countries an exceptionally big drop of employment (-9.2 p.p.) of the age group 15-64 was reported for Latvia which is struggling with the crisis. Drop of employment was more significant for men than for women population.
A big y-o-y decrease of total employment did not show, however, in all groups of productive age. Employment rate of elderly workers in EU27 even increased on average, and especially among women, so that in the whole group of persons aged 55-64 employment increased by 0.2 p.p. to reach 46.2% (the rate for women increased by 0.7 p.p.). The drop of total employment rate showed in the youngest groups of people owing, among other things, to the increasing of share of people preparing for their future job and also due to the growing number of younger persons who failed to find a permanent job after finishing their studies or who lost their jobs. Job loss was often reported for persons of mid-productive age.
For the economy of the Czech Republic, a high share of employment in the secondary sector (industry and construction) is characteristic. This share was the highest among all EU countries. Since Q1 2009, data on the numbers of employed persons, based on the new classification of economic activities NACE Rev. 2, are available. The data confirm, that in the Czech Republic most people are working in the manufacturing industry (in total 24.8 % of all employed people in the Czech Republic) and Slovakia and Hungary are approaching this share.
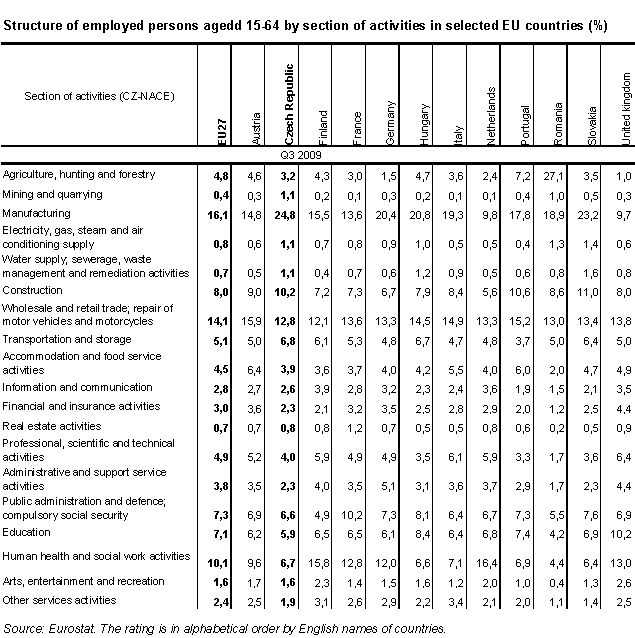
From the y-o-y development of the share of belonging to particular sections of activities in these countries it results, that the share of employees in the manufacturing industry decreased practically in all EU-27 countries. In some states, the big decrease of the number of employees in the manufacturing industry is statistically significant The biggest decrease took place just in the Czech Republic, by 3.3 p.p., and in many other countries, including Slovakia and Romania, the number decreased by 2-3 p.p. The development of the share of employees in other branch sections fluctuated in particular countries. A slight y-o-y decrease of employment was also registered in construction. It is obvious, that the economic decrease showed itself among the employed unambiguously just in the manufacturing industry, which plays the key role in the economy of many EU countries.
The share of full time workers in the main job was the third highest among all 27 member countries of the EU. The share of full-time workers was higher in Slovakia and Bulgaria though, but the total unemployment rate was below average in these countries. The share of male full-time workers in the Czech Republic was in Q3 2009 the third highest in the EU-27, full-time working women showed the fourth highest share.
Especially for women, an extraordinary high differentiation of the share of full-time workers on employment was observed in particular EU countries. In many EU-15 countries, a high number of women utilized the possibility of part-time working, namely in the Netherlands (more than ¾ of employed women at the age of 15+) and in further five countries the share of part-time workers exceeded 40 % of the total female employment.
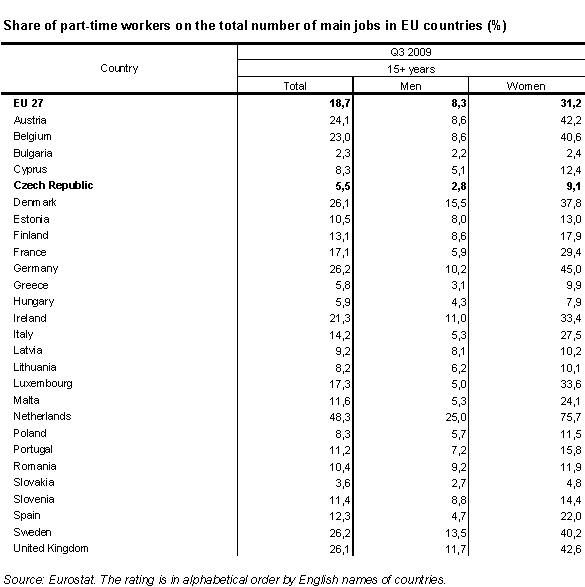
The possibility of part-time work is one of the social aspects, which in the long term influences the fertility rate and the length of the active working life namely in the Netherlands and in some other countries. Just the frequent utilisation of part-time working markedly boosts the working activity of people round the age of sixty.
In the y-o-y comparison, the share of part-time workers increased by 0,70p.p. in the EU-27 total. The shift from the category of full-time work was striking namely in Latvia and Estonia. In the Czech Republic, the y-o-y increase of the share of part-time work was equal to that in EU-27. The low starting base of the Czech Republic and also, for example in Slovakia, however, should be taken into account.
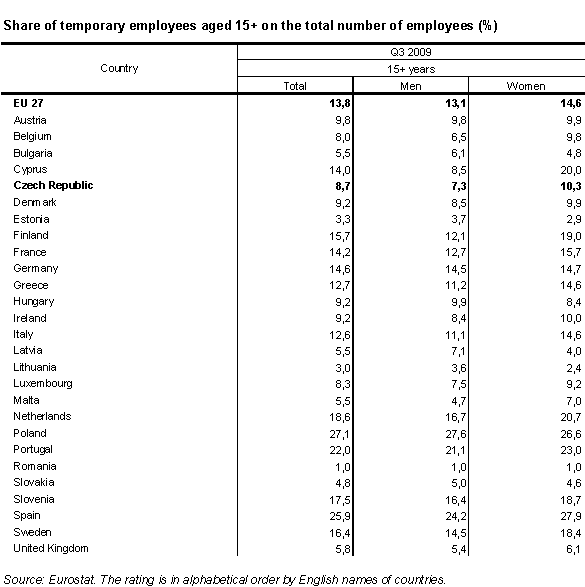
Within the category of employees, the share of temporary employees may be identified. Differences in this share within the EU-27 are big: it varies from 1 % of all employees in Romania to more than one quarter of all employees in Spain and Poland. In the Czech Republic, this share reached 8.7 %, which means the eleventh lowest value in EU-27. However, the Czech Republic was one of the countries with an increased shore (by 0.5 p.p.), while in the EU total the share decreased by 0.5 p.p.
b) Unemployment
The general unemployment rate remained in Q3 2009 lower than the average rate for all EU countries, when not only the male unemployment rate is relatively low, but even the female unemployment rate is below average. Compared to Q2, unemployment in the prevailing majority of EU countries was continually slowly increasing. The lowest unemployment rate was observed in the Netherlands, among the neighbouring states the rate was low in Austria. On the other hand, in Slovakia, the rate was markedly higher; also Poland reported a higher unemployment rate.
The situation is critical namely in the Baltic countries, in Spain and in Ireland, thus in countries, where at the same time a sharp decrease of the total employment rate (the share of the number of employed on the total country population at the productive age) was observed.
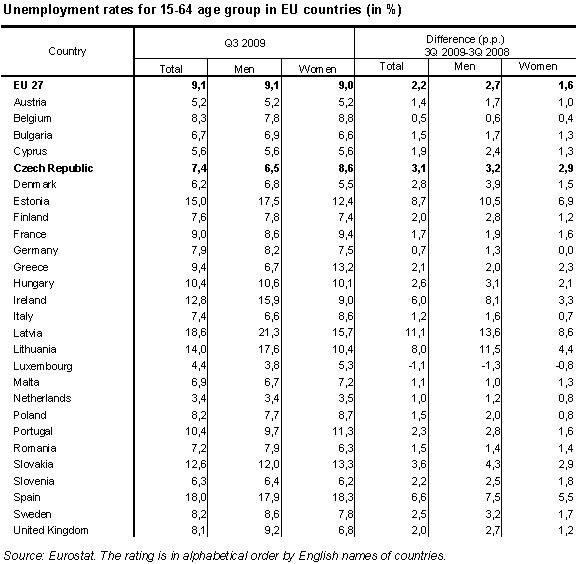
In Q3 last year, the unemployment rate in the age group 15-64 reached 9,1 % for men and thus was higher than the same rate for women (9,0 %). The rate of unemployment by sex is influenced by the number of economically inactive, which is usually higher for women, but in spite of this the economic decrease showed itself more markedly in branches and professions, in which men prevail. In y-o-y comparison, the unemployment rate increased in all EU countries except Luxembourg, where a decrease was registered.
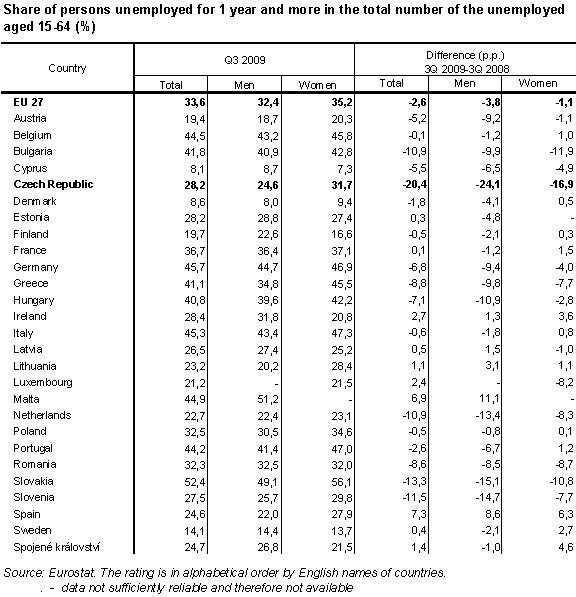
Given the growing unemployment it seems to be a paradox when another structural indicator of Eurostat, i.e. the share of long-term unemployed (for 1 year and more) in the total unemployment improved markedly. For the total of member states the indicator dropped by 2.6 p.p., y-o-y to 33.6% in Q3 2009. Unless important changes in the labour market occur, it can be expected that the long-term unemployment will resume the level reached in 2008. Moreover, the biggest drop of the indicator was recorded in two countries, so far showing the highest values – in the Czech Republic and in Slovakia due to obvious following reasons:
- increasing number of young people who after finishing of their studies have not succeeded to find their first job
- especially due to dismissals by the end of 2008 and in 2009 – as a response of many companies and organisations to their troublesome economic situation
- some long-term unemployed have moved to the group of economically inactive persons or found their jobs.
Published: 05.02.2010
The data are valid as of the release date of the publication.
Contact: Information Services Unit - Headquarters, tel.: +420 274 056 789, email: infoservis@czso.cz


