
Economic activity of the population - 1. quarter of 2007
04.05.2007
Code: e-3133-07


Economic activity of the population in Q1 2007
Employment in the primary sector (agriculture, forestry, fishing) decreased by 1.9 thousand to 174.8 thousand persons year-on-year and made up only 3.6% of the total number of first (main) jobholders. The number of persons employed in the secondary sector (industry, construction) increased compared to Q1 2006 by 38.7 thousand to 1 949.6 thousand (40.1% of total employment). This growth was mainly affected by the year-on-year increase of 39.2 thousand in employment that occurred in ‘manufacturing’. The number of employed persons went up most in ‘manufacture of parts and accessories for motor vehicles and their engines’ (+22.6 thousand), ’manufacture of plastic products’ (+8.6 thousand), ‘manufacture of basic iron and steel and ferroy-alloys’ (+7.1 thousand) and ‘manufacture of office machinery and computers’ (+6.0 thousand). Decrease in the number of employed in ‘electricity, gas and water supply’ by 3.8 thousand showed itself most in ‘steam and hot water supply’. 1 )
Employment in the tertiary sector (all divisions of services including transport) increased by 43.2 thousand to 2 739.7 thousand (56.3% of total employment), but it developed in the individual divisions in an opposing way. Employment increased most in ‘real estate; renting and business activities’ (+23.9 thousand) ‘health and social work’ (+18.5 thousand), and ‘public administration and defence; compulsory social security’ (+11.3 thousand).
Within the section ‘real estate; renting and business activities’ the growth showed mostly in the section ‘legal, accounting and book-keeping activities; market research and public opinion polling’, in ‘investigation and security activities’ and in ‘software consultancy and supply’. In ‘health and social work’ employment increased the most in ‘human health activities’ and within the section ‘public administration and defence; compulsory social security’ the number of employees increased mainly in the section ‘regulation of and contribution to more efficient operation of business’ and ‘supporting activities for the government as a whole’. The number of employed in ‘general public services activities’ however dropped year-on-year. In this connection it is necessary to say that differences compared to corporate statistics result, apart from other things, from the fact that the conception of employees in the selective survey has a more general character and does not directly apply to the so called registration number of employees.
On the other hand, employment dropped most year-on-year in ‘education’ (-4.9 thousand), mainly in ‘primary education’ (-11.1 thousand). Employment dropped also in ‘wholesale and retail trade; repair of motor vehicles and household goods’ (-4.3 thousand), the most in ‘retail sale of food, beverages and tobacco in specialised stores’.
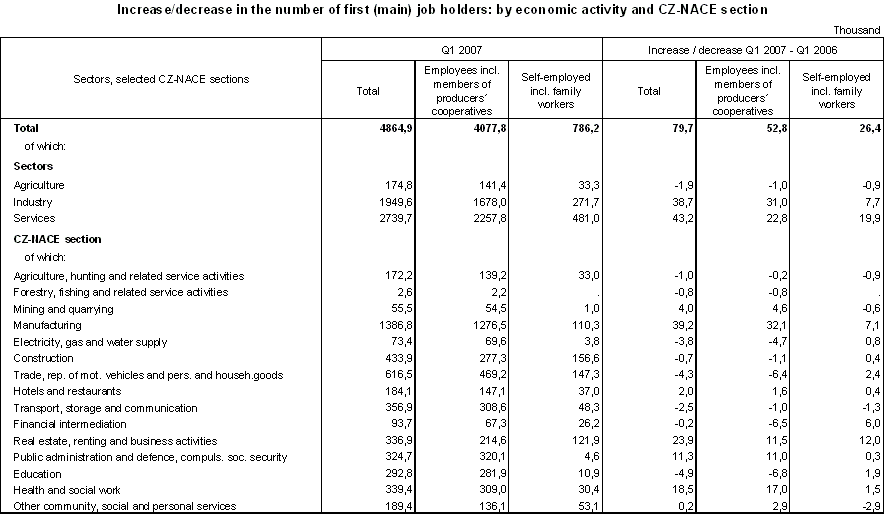
An increase in the total number of self-employed by 26.4 thousand showed itself mainly in the section ‘real estate; renting and business activities’ (+12.0 thousand). Year-on-year increase in the number of self-employed persons, including contributing family workers was the highest in ‘legal, accounting, book-keeping and auditing activities; tax consultancy; market research and public opinion polling; business and management consultancy; holdings’ and in ‘miscellaneous business activities’ (+7.9 thousand), in ‘real estate activities on a free or contract basis’. In ‘manufacturing’ (+7.1 thousand) the number of self-employed increased the most in ‘manufacture of beverages’ and in ‘financial intermediation’ in the section ‘insurance and pension funding, except compulsory social security’. Compared to Q1 2006 the number of self-employed markedly increased also in ‘building installation’ and ‘building completion’.
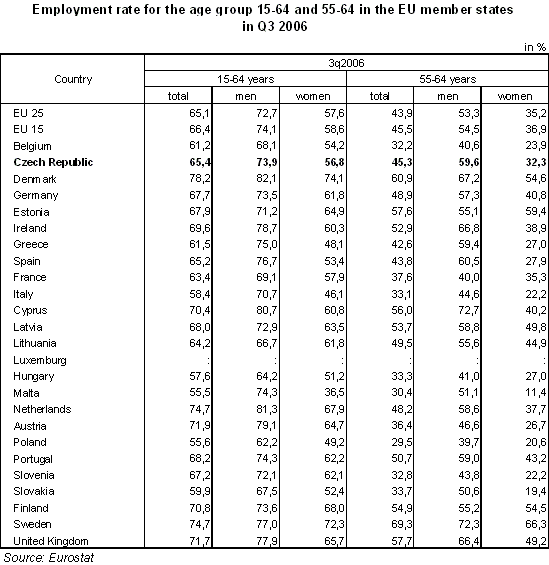
The total employment rate of persons aged 15-64 grew year-on-year by 0.7 percentage points to 65.5%. The relative increase was higher in the employment of men at working age (+0.1 percentage points to 74.1%), while employment of women was 0.4 percentage points up and reached 56.9%. The employment rate is pushed down by a fast growth of the number of students at universities on the one hand, and, on the other hand, the number of persons in employment is increasing due to the concurrence of employment of strong age groups born at the turn of the forties and fifties and in the middle of seventies
Concrete aims for the employment rate in the EU countries until 2010 were determined in the meetings of the European Council in Lisbon in 2000 and Stockholm in 2001. The total employment rate should reach at least 70%, employment rate of women at least 60% and the employment rate of the elderly aged 55-64 at least 50%.
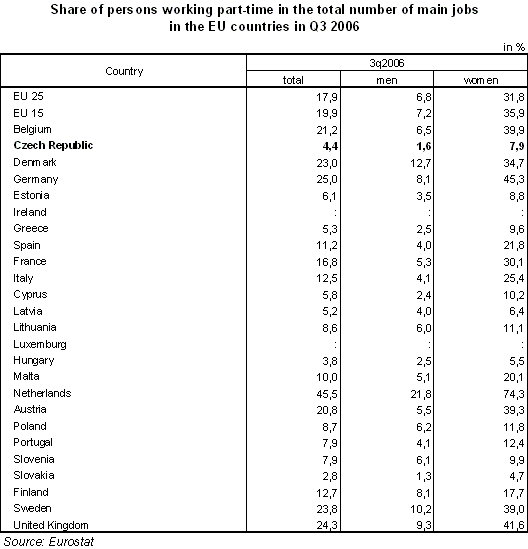
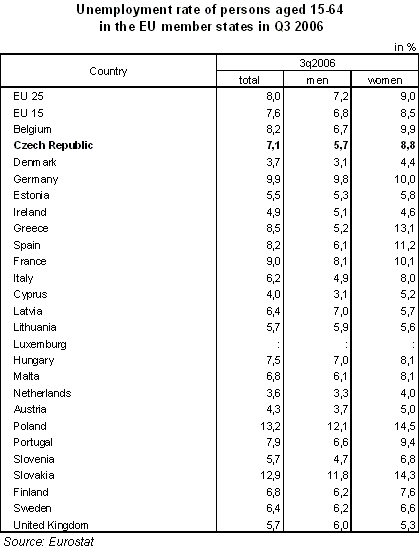
Compared internationally, the Czech Republic is among the countries with the above-the-average employment intensity in the EU. According to the latest complete data for Q3 2006 released by the Eurostat, the employment rate of persons aged 15-64 in the Czech Republic was higher than the total for EU25 but was lower than the level in the EU15. Lower employment level than in EU 15 and EU 25 was in the group of women.
Nevertheless, differences in employment rates are considerable, not only if we compare the whole age group 15-64, but also in the male and female components of employment. On the one hand, there is a high level of employment in the northern countries and the United Kingdom (e.g. in Denmark it was 78.2% in Q3 2006), on the other hand in many countries the level of employment was lower than 60% (in Poland it reached only 55.6% in Q3 2006). Compared to our neighbour states, higher level of employment is in Austria and slightly higher also in Germany, level of employment in Poland and also in Slovakia is, however, significantly lower. Very low unemployment rate is also in Hungary.
Even bigger differences are in the employment level of persons aged 55-64. In Poland it did not even reach 30% and this level was only closely exceeded by Malta, Slovenia, Slovakia, Italy, Hungary and Belgium. Thus a significant number of member states will have problems with the fulfilment of the Lisbon strategy. In the CR, the achievement of at least 50% of employment in this ten years age group is going to be also complicated, mainly due to the low employment rate of women. The employment rate of women aged 55-64 is lower than not only in the EU15 but also within the whole EU25. It is, however, possible to assume that in the following years this rate is going to rise also as a consequence of setting of the conditions for getting old-age pension.
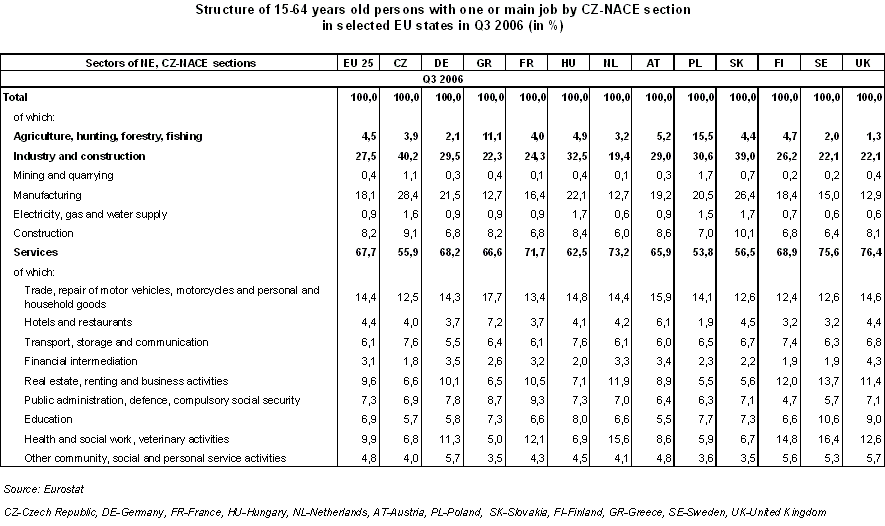
For the CR’s economy a high share of employment in the secondary sector (industry + construction) is typical. This share is the highest among all of the EU25 countries and the closest are only shares of this sector in total employment in Slovakia. Similarly, in ‘manufacturing’ its share in the CR reached 28.4% of total employment in Q3 2006. This is the highest value among all EU states. In the CR, the share of ‘manufacturing’ was by approximately 10% higher than in the EU25 and by 11 points higher than in the EU15. On the other hand, our branch structure of employment is distinguished by a significantly lower representation of services than in the EU15 (-14% points), but also in the EU25 (-12 % points). Below the average representation has mainly ‘real estate, renting and business activities’, ‘health and social work’, ‘financial intermediation’ and ‘education’. In the following table, there are data on the branch structure of selected EU states in Q3 2006, for which the Eurostat published last complete results.
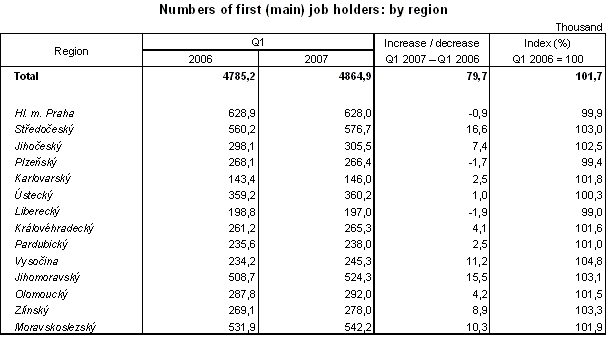
The employment of persons living in the individual regions of the Czech Republic dropped slightly year-on-year in the Liberecký and Plzeňský Region. The number of employed persons on the other hand increased the most particularly in the Středočeský, Jihomoravský and Vysočina Region. A slight drop in Prague is a consequence of the continuing migration from the capital city to the neighbouring districts of the Středočeský Region.
There were almost 94.9% of persons working full time in their main job in the civil sector of the national economy. Nearly 245.3 thousand persons worked part-time in their main job, most of them were women (180.3 thousand).
The share of persons working full time in their main job is in the CR the third highest among all EU member states. Representation of full time jobs is higher in Slovakia and Hungary, the total employment rate is however below the average in Slovakia and Hungary. The share of men working full time in the CR was the second highest in Q3 2006 among the EU25, women had the fourth highest share.
Especially women appear to have an extraordinary high differentiation of the shares of full time jobs in employment in individual EU countries. In several countries of the original EU15, high number of women uses the opportunity to work part time, particularly in the Netherlands (3/4 of working women aged 15-64 years!) and in the other five countries their share came close or exceeded 40% of women employment. The opportunity to work part time is one of the social aspects, which in the long term affects the fertility rate in particular in the Netherlands and in some of the other countries.
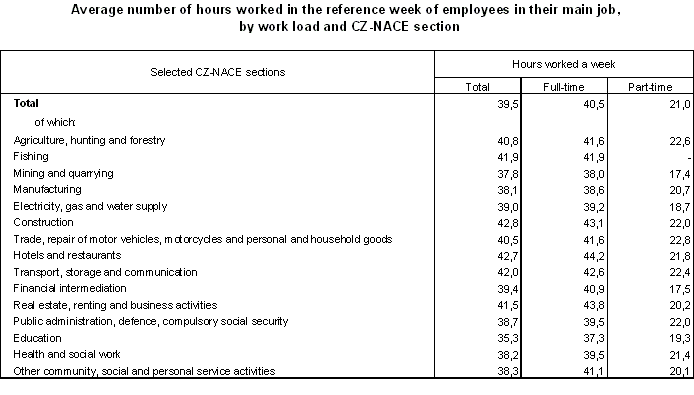
The number of hours actually worked in the reference week reached 39.5 hours, in full-time employment it was 40.5 hours. The differences in working hours of employees are large, both in terms of their professional status and industry (CZ-NACE sections). The self-employed worked approximately 48.2 hours a week, members of producer cooperatives 39.9 hours, the category of full-time employees followed with approximately 39.1 hours worked. In the long term, these differences are apparent both for men and women when generally men work longer in all of the status categories. The most hours worked in their main job had employees in construction (42.8 hours), the least had employees in education (35.3 hours).
With the growing total employment of the residing population and the economically inactive, the number of the unemployed decreased. The number of unemployed persons (ILO methodology) reached 311.2 thousand on average in Q1 2007, i.e. a fall of 102.9 thousand year-on-year. The number of the unemployed decreased mainly in the age group 20-24 by 21.4 thousand; and in the age group 25-29 (-16.9 thousand). The number of unemployed men (139.4 thousand in total) is still below the number of unemployed women (171.8 thousand). Under the total year-on-year drop in unemployment, the unemployment of men decreased by 53.0 thousand, and the decrease showed itself in the whole group of 15-64 years old persons, except 40-44 years old and 60-64 years old persons. Over the same period, the number of unemployed women decreased by 49.9 thousand in total, it dropped in all of the other five years age groups.
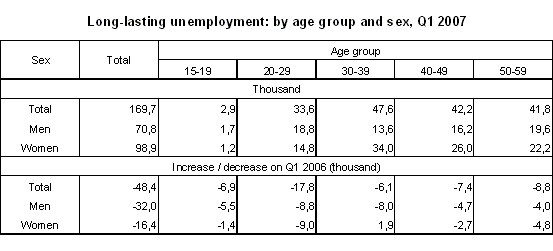
The number of persons unemployed for a long time (1 year or more) fell by 48.4 thousand. Taking this total drop into consideration, a slight increase in the whole age group 15-60 years was only recorded among women in their thirties due to the natural shift in the population age structure.
The number of the unemployed with basic education decreased by 24.5% year-on-year to 79.4 thousand, which is connected with a general decrease of the number of persons in the productive age with the lowest level of education. The number of unemployed persons with secondary education without GCSE (with secondary vocational education in particular) decreased by 23.3% to 148.0 thousand and the number of the unemployed with secondary education (with GCSE) decreased by 26.6% to 72.2 thousand. The number of unemployed university graduates dropped by 34.5% to 11.5 thousand; the unemployment of university graduates is still markedly lower when compared to the first three groups.
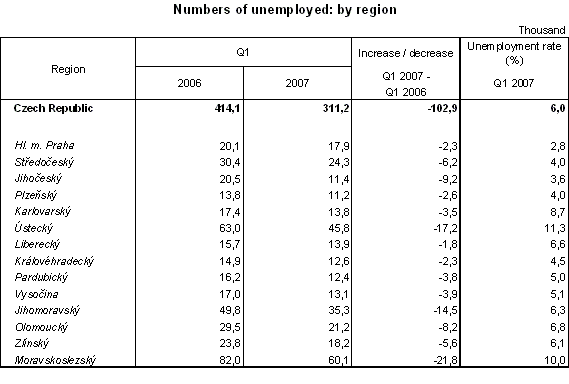
Year-on-year, the unemployment dropped in all of the regions of the republic, the most in areas with high or above the average unemployment rate i.e. in the Moravskoslezský, Ústecký Region and further in the Jihomoravský Region.
The growth of total employment and the decrease in the number of the unemployed resulted in a relatively high decrease of general unemployment rate of persons aged 15-64 (ILO). In comparison to Q1 2006, the general unemployment rate decreased by 1.9 percentage points to 6.1%. It decreased mainly among the female population (by 2.1 percentage points to 7.6%), while it dropped among the men population by 1.8 percentage points to 4.8%. According to the latest complete results of the Eurostat for Q3 2006 the general unemployment rate in the Czech Republic was markedly lower than in the EU25, when with a relatively low unemployment level of men the level of unemployment of women in the CR was also below the average of the EU25. The big decrease of unemployment during the last year in the Czech Republic had a positive effect in both of the comparisons with the EU25 and EU15 countries when in Q3 2006 the unemployment rate in the CR was lower than the average of the EU15 by 0.5 percentage points.
Compared to the neighbour states, the level of unemployment is higher than in Austria but markedly lower than in Poland and Slovakia, where it is still extremely high and the highest throughout the Union. Our unemployment level is noticeably lower also in comparison with Germany mainly due to an unfavourable situation in the long run in the federal states in the regions of former DDR.
The number of economically inactive persons aged 15+ (according to the LFSS methodology they are persons who had no job and were not seeking a job during last four weeks or did not meet all conditions for being classified among the unemployed) increased by 81.4 thousand year-on-year and reached 3 636.3 thousand in Q1 2007. This category is primarily affected by numbers of the retired and of persons preparing for their future occupation. The number of basic school pupils decreased by 2.8 thousand; the number of secondary school pupils including vocational schools increased by 14.1 thousand to 531.2 thousand. The number of university students including higher professional school students grew by 10.9 thousand to 275.1 thousand. The number of economically inactive normally retired persons not actively seeking job reached 1 887.0 thousand, the number of persons in early retirement 48.2 thousand and the number of disability pensioners 236.8 thousand. These figures cannot accurately correspond to the statistics on pupils and students compiled by the Ministry of Education Youth and Sports of the CR or to the numbers of pensioners on the records of the Ministry of Labour and Social Affairs of the CR because the pupils, students or pensioners who fulfilled the criterion of being classified among persons in employment or unemployed persons in the reference week are not reported as economically inactive.
_____________
1) Note: When evaluating the branch structure of the employed it is necessary to take in to consideration the methodology of sample survey, which is carried out only in flats and not in collective accommodation establishments. Data on the number of employed from LFSS is then corrected by statistics within the harmonization with data on employment development of foreign state citizens in the branch. According to the available data from the Ministry of Labour and Social Affairs of the CR last year saw a marked increase of the number of foreign citizens in construction who mostly do not live in flats.
Published: 04.05.2007
The data are valid as of the release date of the publication.
Contact: Information Services Unit - Headquarters, tel.: +420 274 056 789, email: infoservis@czso.cz


