
Comparison of Regions in the Czech Republic - 2018
Graphs
Attachments
| Average annual air temperature by region in 2017 | PNG |
| Specific emissions of main pollutants into air by region in 2016 | PNG |
| Environmental protection investments by region of the investor registered office in 2017 | PNG |
| Wastewater treatment sludge disposal method by region in 2017 | PNG |
| Amount of wastewater discharged and treated by region in 2017 | PNG |
| Waste generated by enterprises by registered in 2017 | PNG |
| Population change by region in 2017 (per 1 000 mid-year population) | PNG |
| Gross domestic product per the employed by region | PNG |
| Revenue-expenditure balance local government budgets by region | PNG |
| Percentage of unemployed persons and the number of job applicants kept in the labour office register per job vacancy kept in the labour office register by region as at 31 December 2017 | PNG |
| Natural persons and legal persons by region as at 31 December 2017 | PNG |
| Births and deaths of businesses by region in 2017 | PNG |
| Livestock by region as at 1 April 2018 | PNG |
| Consumption of mineral fertilisers by region in the crop year 2016/2017 | PNG |
| Wild boar shot by region | PNG |
| Sales of goods and services incidental to industry per employee by region | PNG |
| Consumption of natural gas in households by region in 2017 | PNG |
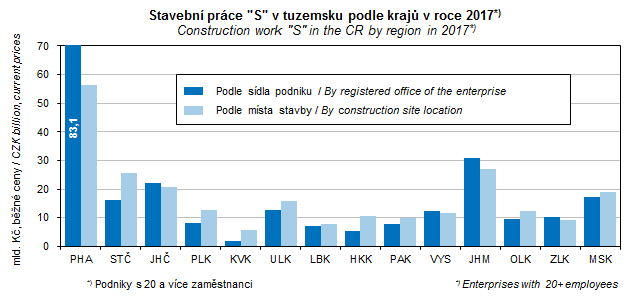
| Construction work "S" in the CR by region in 2017 | PNG |
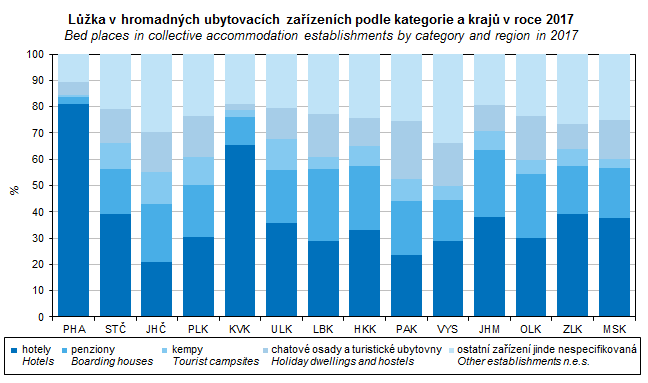
| Bed places in collective accommodation establishments by category and region in 2017 | PNG |
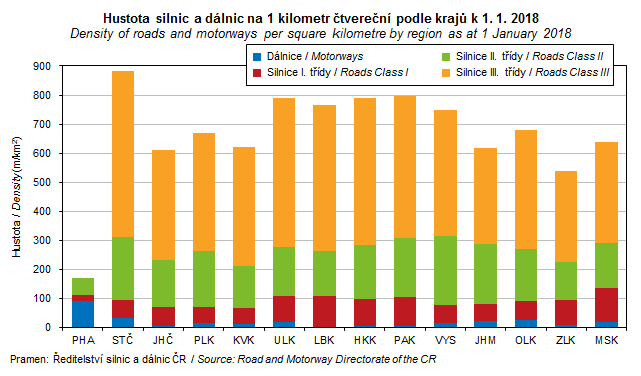
| Density of roads and motorways per square kilometre by region as at 1 January 2018 | PNG |
| Selected indicators on cohesion regions by region in 2017 | PNG |
Published: 16.01.2019
The data are valid as of the release date of the publication.


