
Statistical Yearbook of the Moravskoslezský Region - 2014
Graphs
Attachments
| Graph 1-1. Selected indicators on the Moravskoslezský Region in comparison with the Czech Republic average in 2013 | JPG |
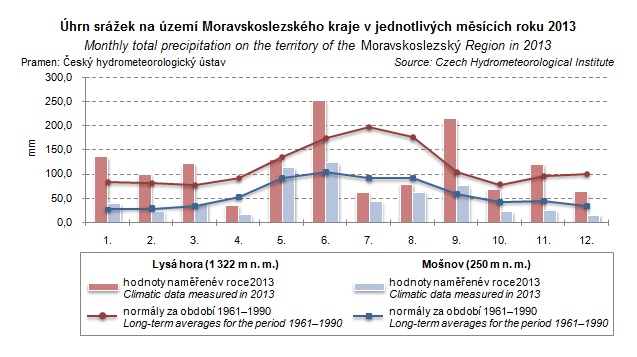
| Graph 2-1. Monthly total precipitation on the territory of the Moravskoslezský Region in 2013 | JPG |
| Graph 3-1. Environmental protection investments by region of the investor registered office in 2013 | JPG |
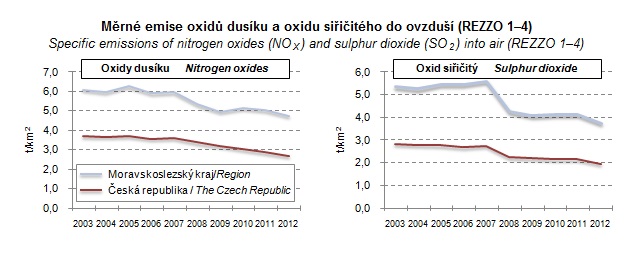
| Graph 3-2. Specific emissions of nitrogen oxides (NOX) and sulphur dioxide (SO2) into air (REZZO 1–4) | JPG |
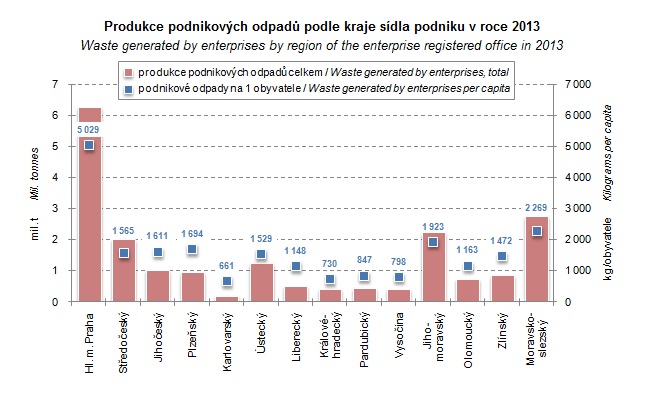
| Graph 3-3. Waste generated by enterprises by region of the enterprise registered office in 2013 | JPG |
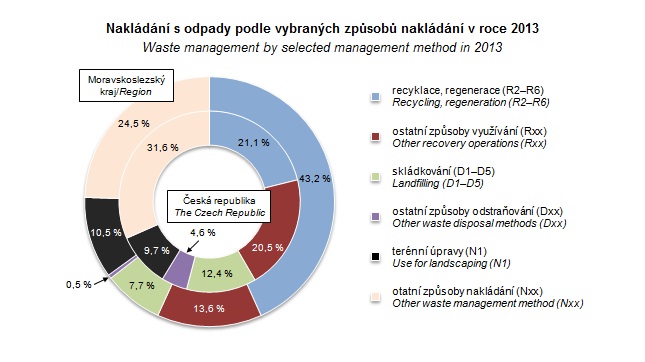
| Graph 3-4. Waste management by selected management method in 2013 | JPG |
| Graph 4-1. Age distribution of the population in the Moravskoslezský Region in 2013 and 2035 | JPG |
| Graph 4-2. Shares of live births in marriage and outside marriage by region in 2013 | JPG |
| Graph 4-3. Natural population increase/decrease in the Moravskoslezský Region | JPG |
| Graph 4-4. Foreigners in the Moravskoslezský Region | JPG |
| Graph 5-1. Gross fixed capital formation per capita by region (CR average = 100) | JPG |
| Graph 5-2. Gross value added by CZ-NACE in 2013 | JPG |
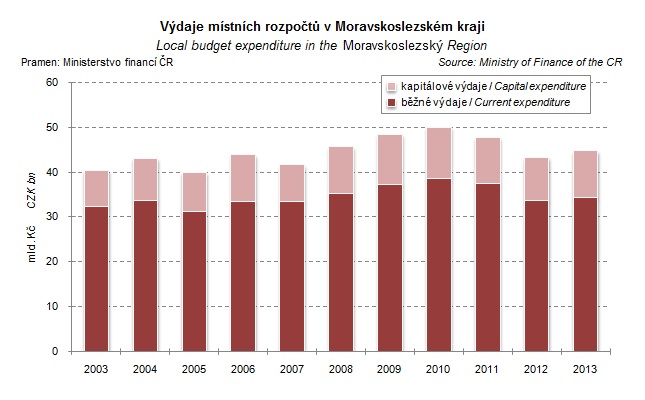
| Graph 6-1. Local budget expenditure in the Moravskoslezský Region | JPG |
| Graph 6-2. Local budget revenue per capita by region in 2013 | JPG |
| Graph 9-1. Average monthly gross wages (full-time equivalent) | JPG |
| Graph 9-2. Share of unemployed persons and number of job applicants per vacancy by region as at 31 December 2013 | JPG |
| Graph 9-3. Share of unemployed persons in the Moravskoslezský Region | JPG |
| Graph 11-1. Harvest of selected crops in the Moravskoslezský Region | JPG |
| Graph 11-2. Livestock in the Moravskoslezský Region | JPG |
| Graph 13-1. Average monthly gross wage per employee in industry by region | JPG |
| Graph 15-1. Construction work according to contracts in 2013 | JPG |
| Graph 16-1. Bed places in collective accommodation establishments by seasonality and region in 2013 | JPG |
| Graph 17-1. Length of roads and motorways per sq km by region as at 31 December 2013 | JPG |
| Graph 18-1. Households with access to selected information and communication technologies in the Moravskoslezský Region | JPG |
| Graph 19-1. R&D expenditure in the Moravskoslezský Region | JPG |
| Graph 20-1. Students of public and private universities in the Moravskoslezský Region | JPG |
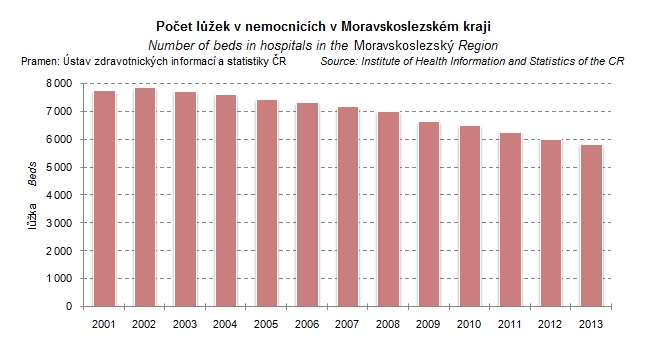
| Graph 21-1. Number of beds in hospitals in the Moravskoslezský Region | JPG |
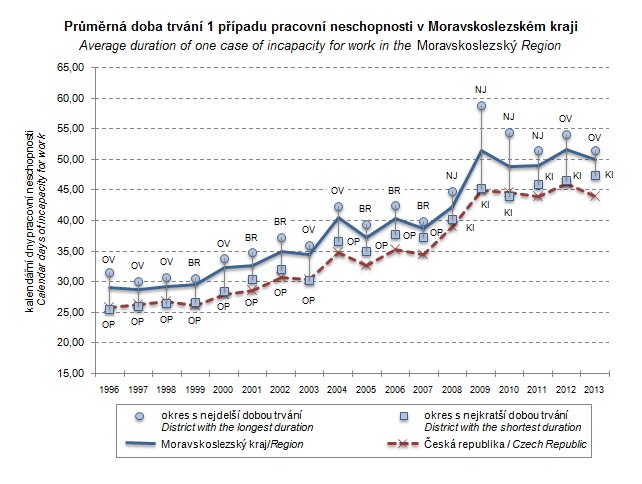
| Graph 21-2. Average duration of one case of incapacity for work in the Moravskoslezský Region | JPG |
| Graph 22-1. Sickness insurance benefits paid by type of benefit in the Moravskoslezský Region | JPG |
| Graph 22-2. Old-age pension recipients by pension amount as at December 2013 | JPG |
| Graph 25-1. Turnout at elections to local councils held in 2006, 2010 and 2014 by district | JPG |
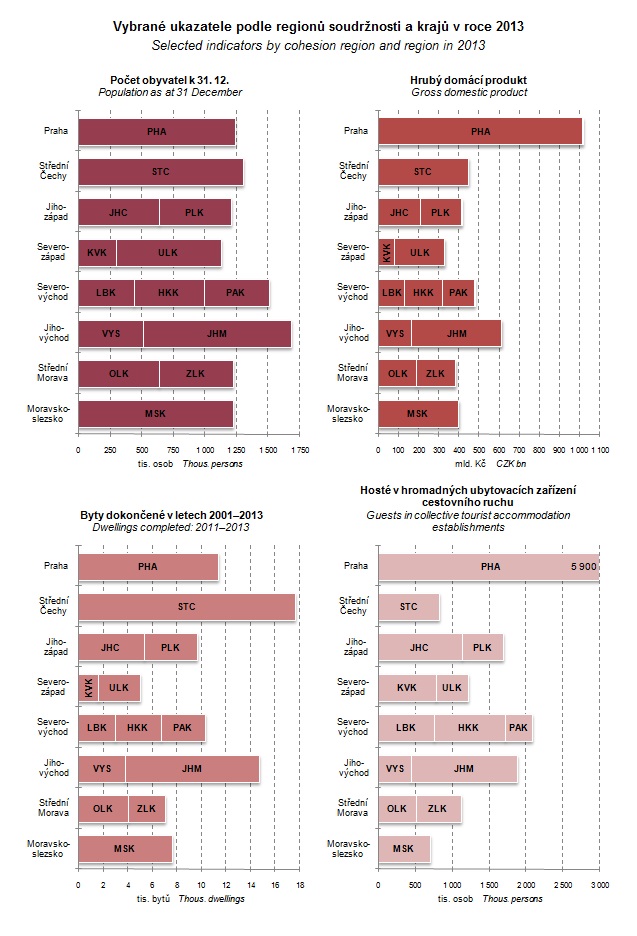
| Graph 27-1. Selected indicators by cohesion region and region in 2013 | JPG |
Published: 29.12.2014
The data are valid as of the release date of the publication.


