
Focus on Women and Men - 2015
Graphs
Attachments
| 2.1. The most common causes of hospitalization by sex and age; 2014 | |
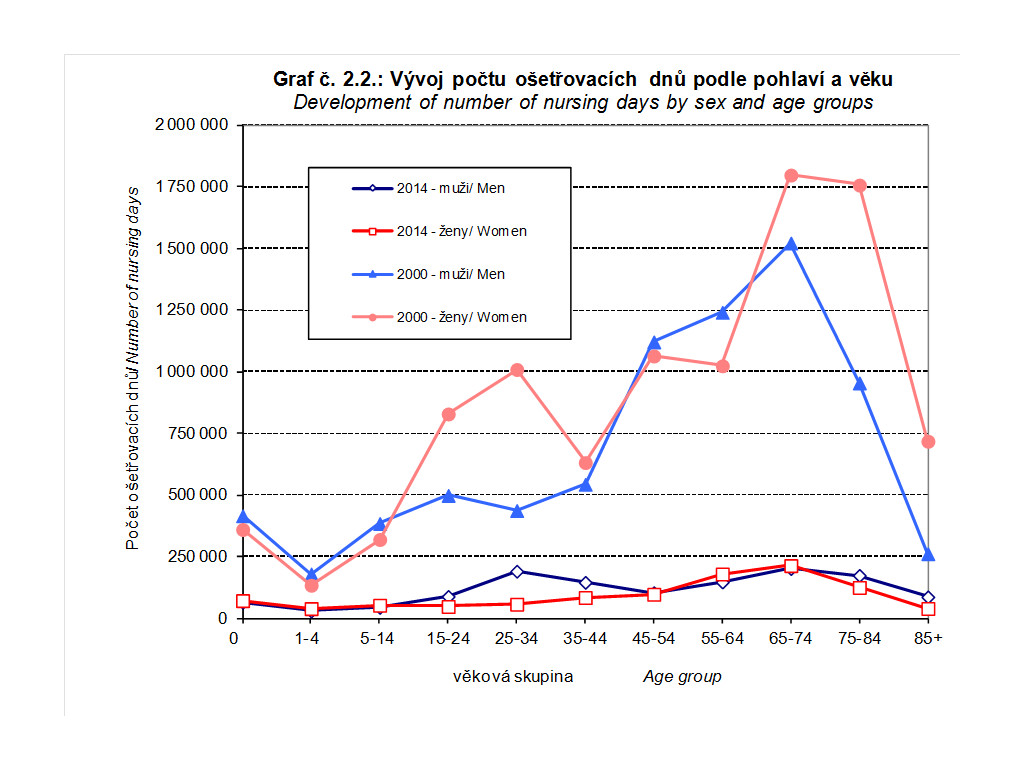
| 2.2. Development of number of nursing days by sex and age groups | JPG |
| 2.3. Life expectancy at birth by educational attainment, 2012 | |
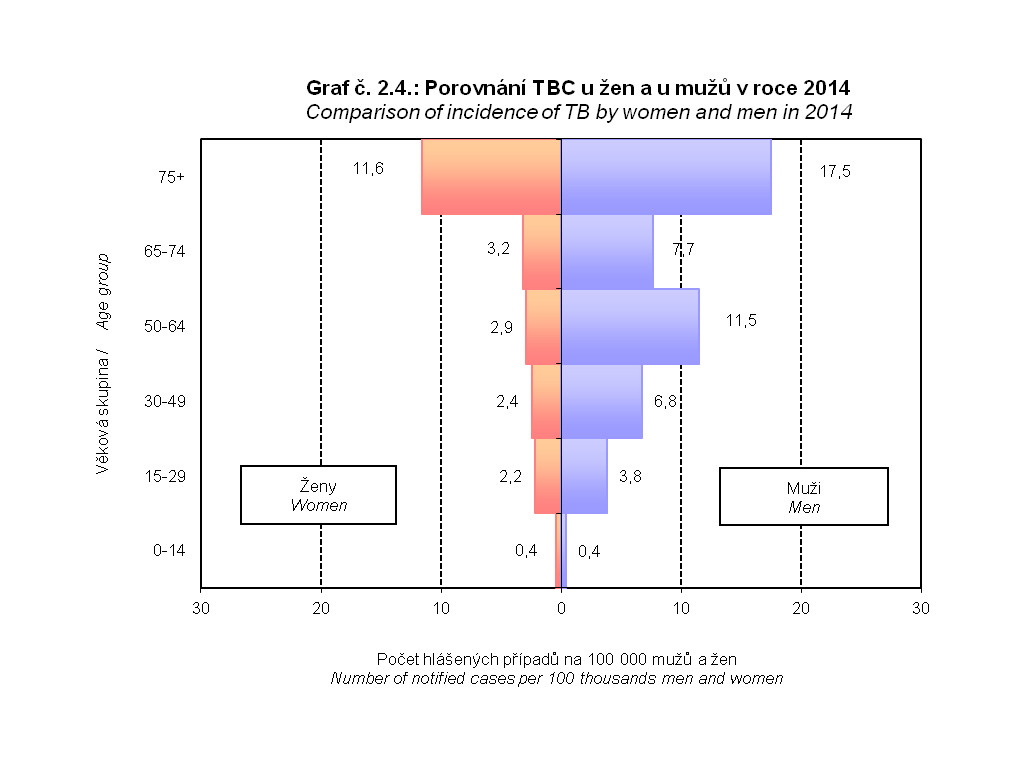
| 2.4. Comparison of incidence of TB by women and men in 2013 | JPG |
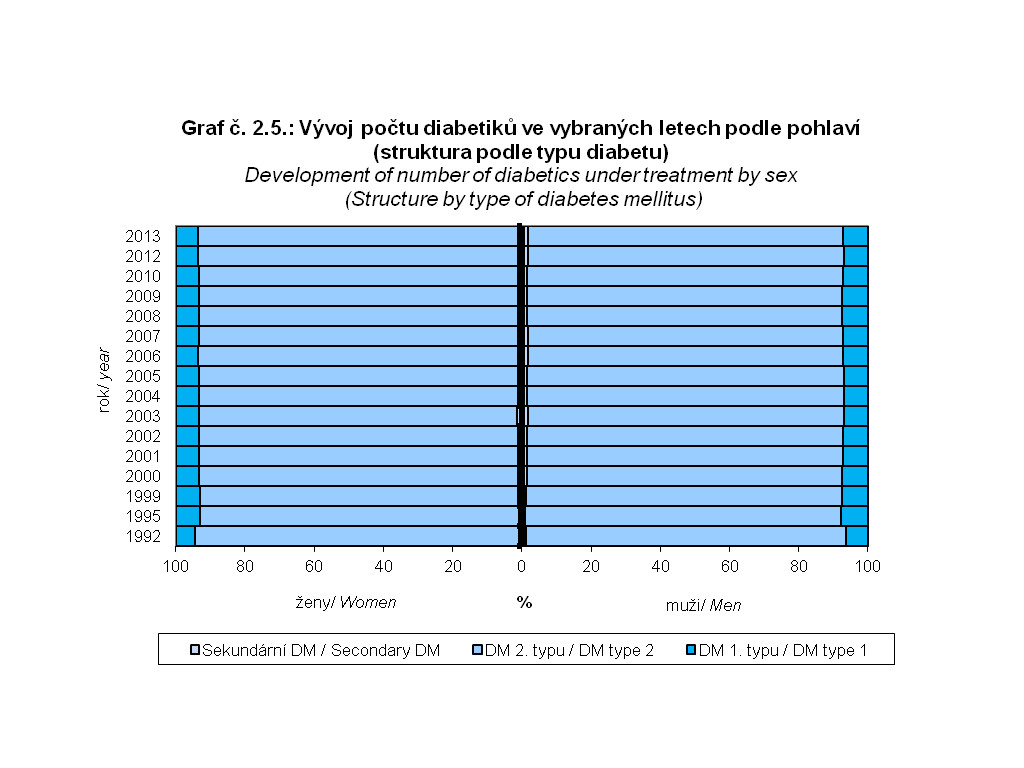
| 2.5. Development of number of diabetics under treatment by sex (Structure by type of diabetes mellitus) | JPG |
| 2.6. Newly notified cases of MN (dg. C00-C97 and dg. D00-D09) per 100 000 inhabitants in 2012 | JPG |
| 2.7. Average costs per treatment of neoplasms in 2013 | JPG |
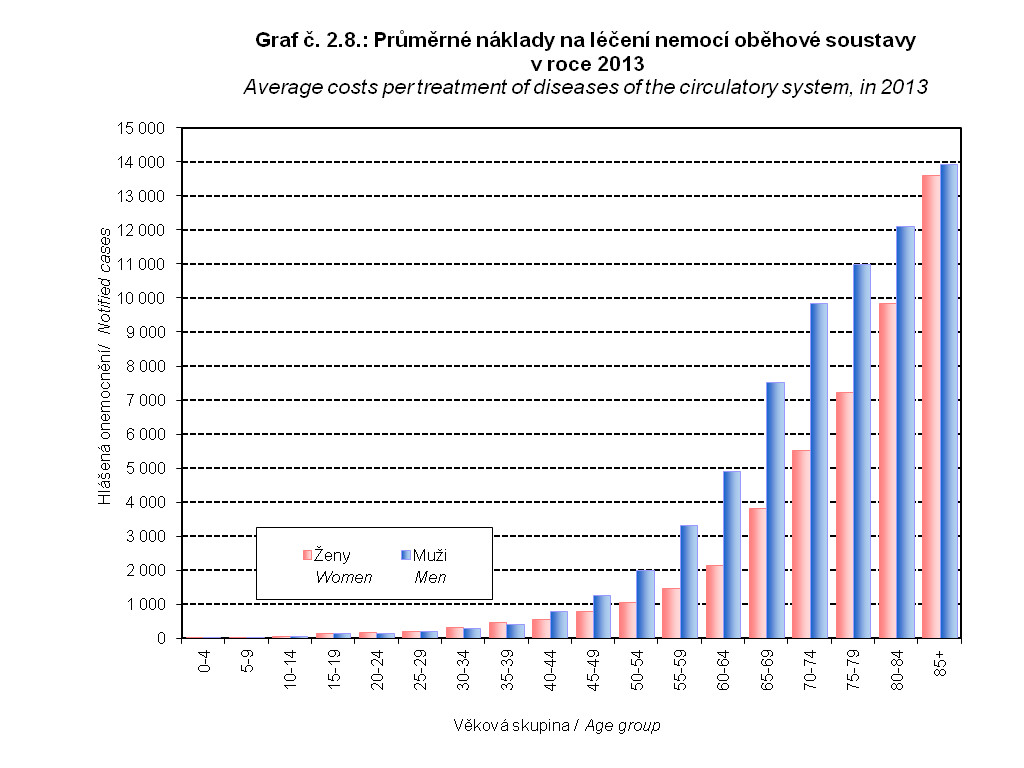
| 2.8. Average costs per treatment of diseases of the circulatory system, 2013 | JPG |
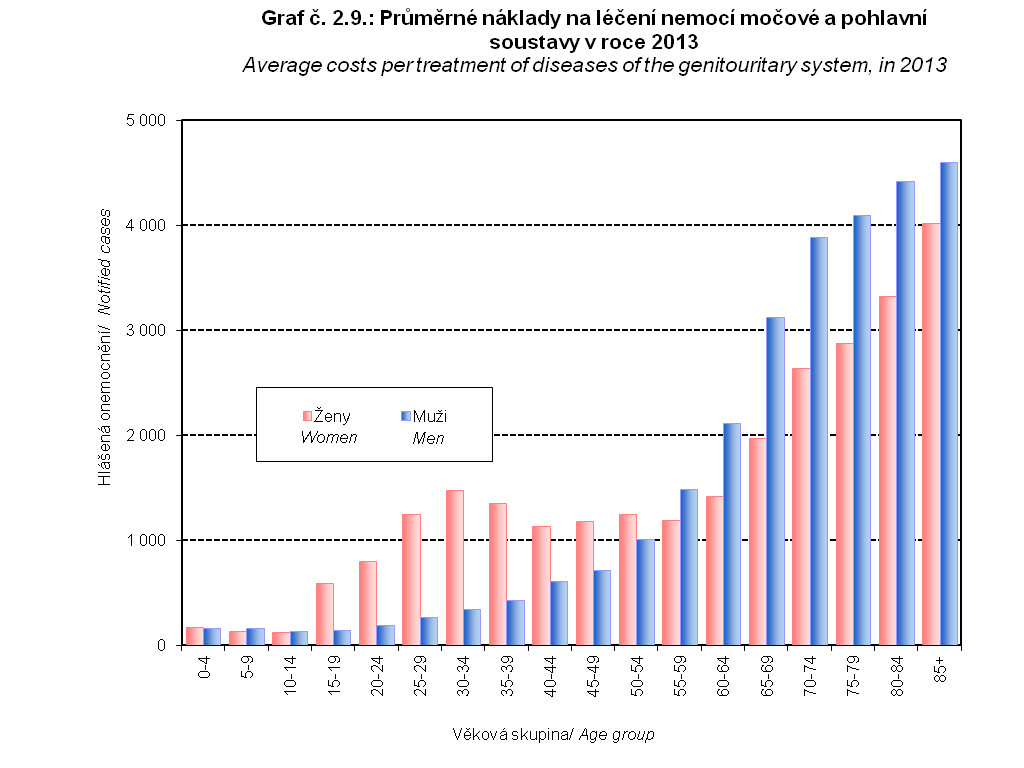
| 2.9. Average costs per treatment of diseases of the genitourinary system, 2013 | JPG |
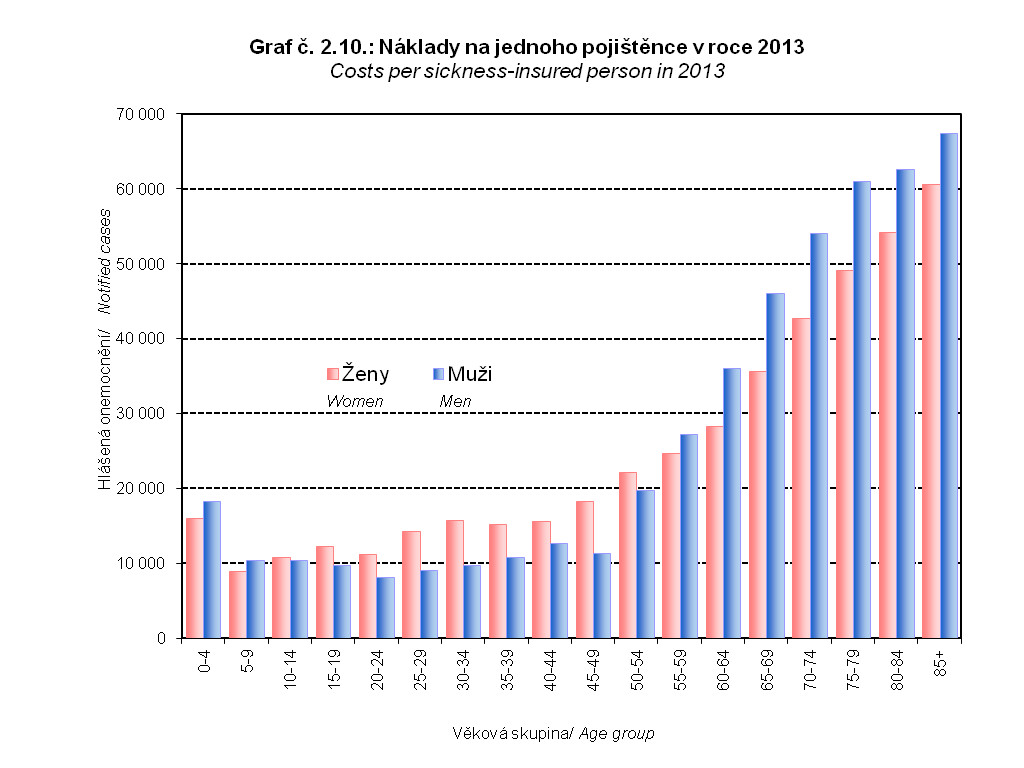
| 2.10. Costs per sickness-insured person in 2013 | JPG |
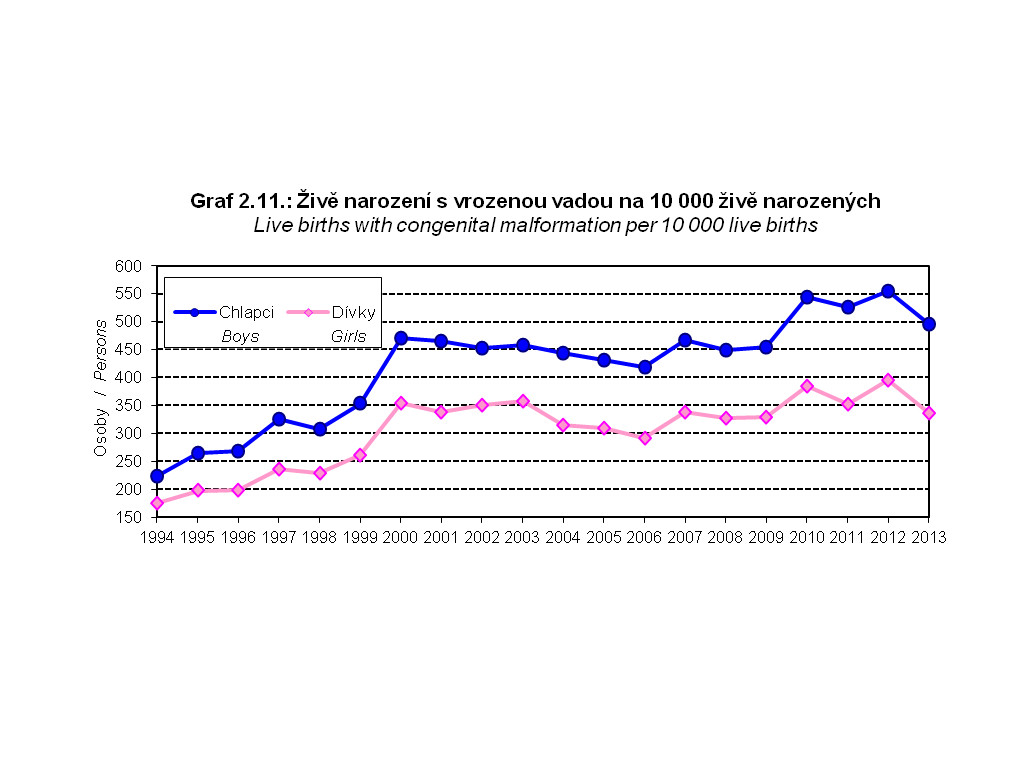
| 2.11. Live births with congenital malformation per 10 000 live births | JPG |
| 2.12. Structure of congenital malformation at live births, 2012 | |
| 2.13. Trend of numbers of live births, LIA and spontaneous abortions | |
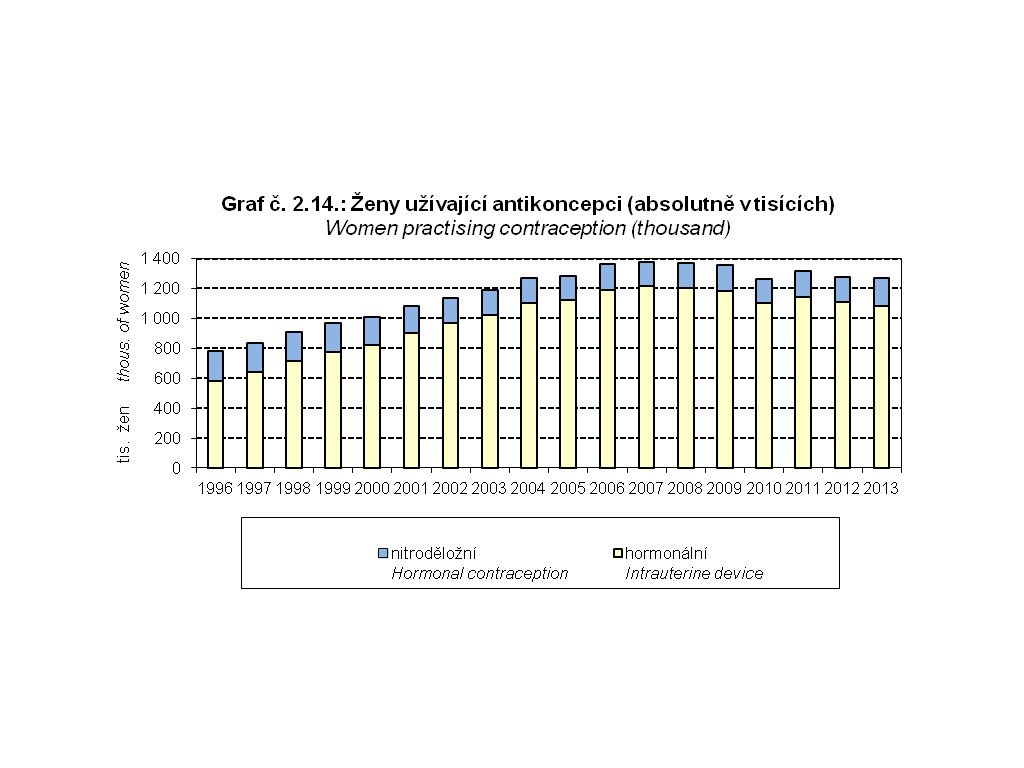
| 2.14. Women practising contraception (thousand) | JPG |
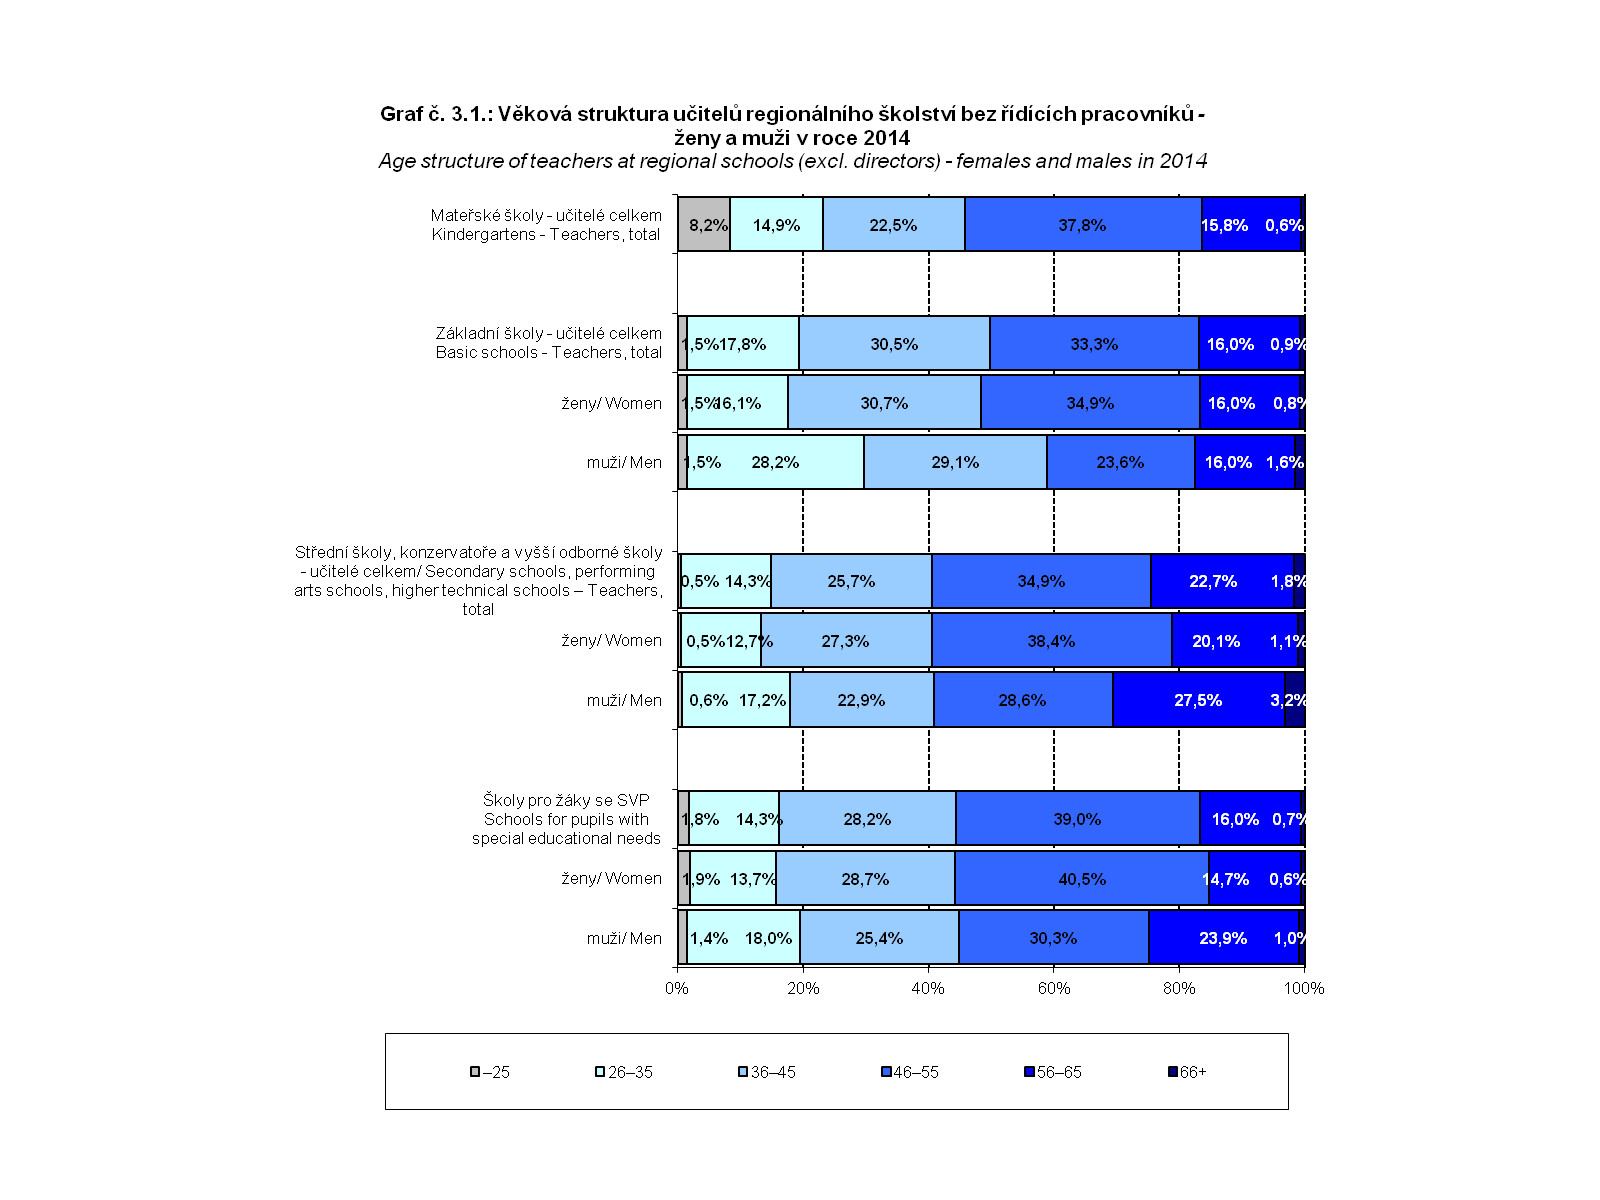
| 3.1. Age structure of teachers at regional schools (excl. directors) - females and males in 2014 | JPG |
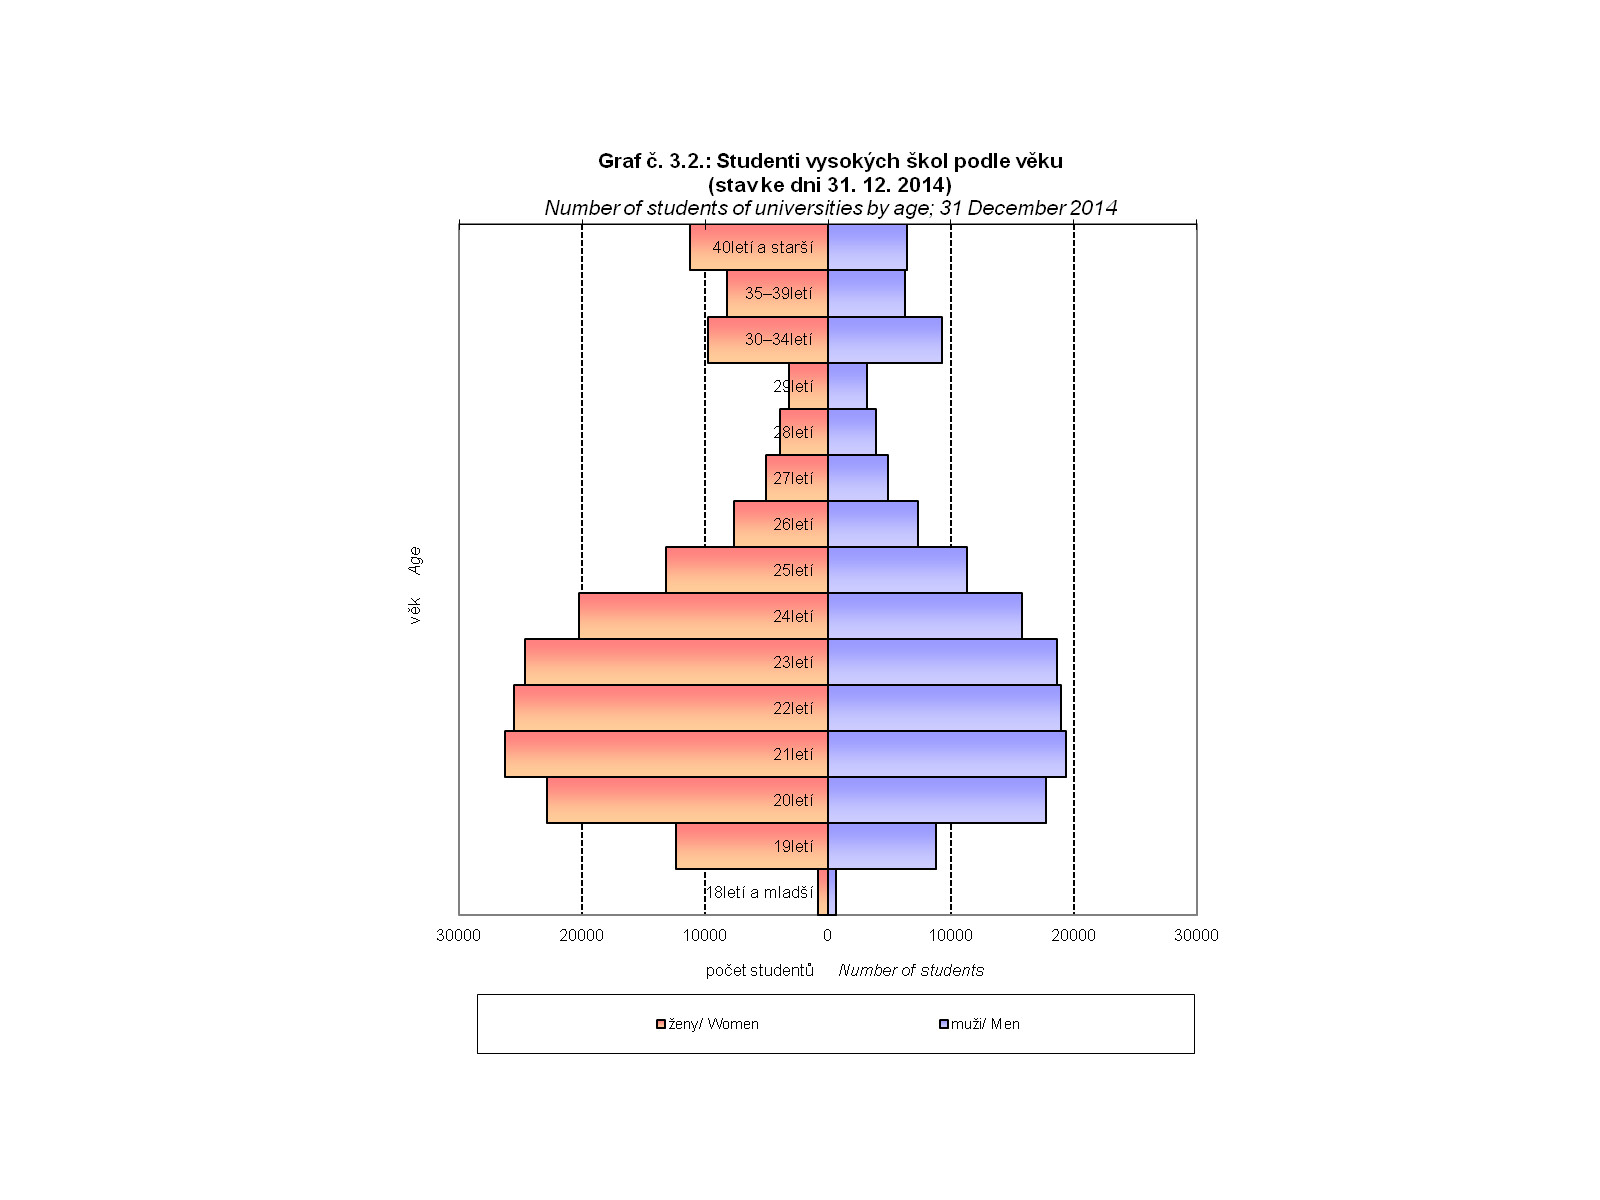
| 3.2. Number of students of universities by age; 31 December 2014 | JPG |
| 4.1. Employed by CZ-NACE in 2014 (LFSS) | |
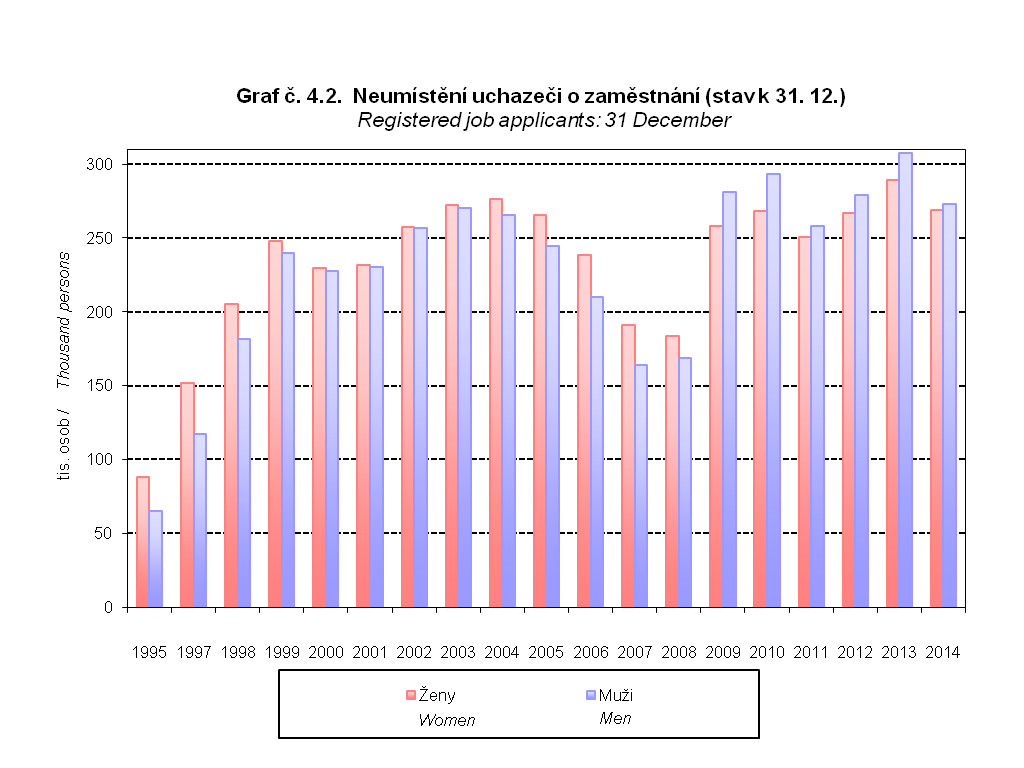
| 4.2. Registered job applicants: 31 December | JPG |
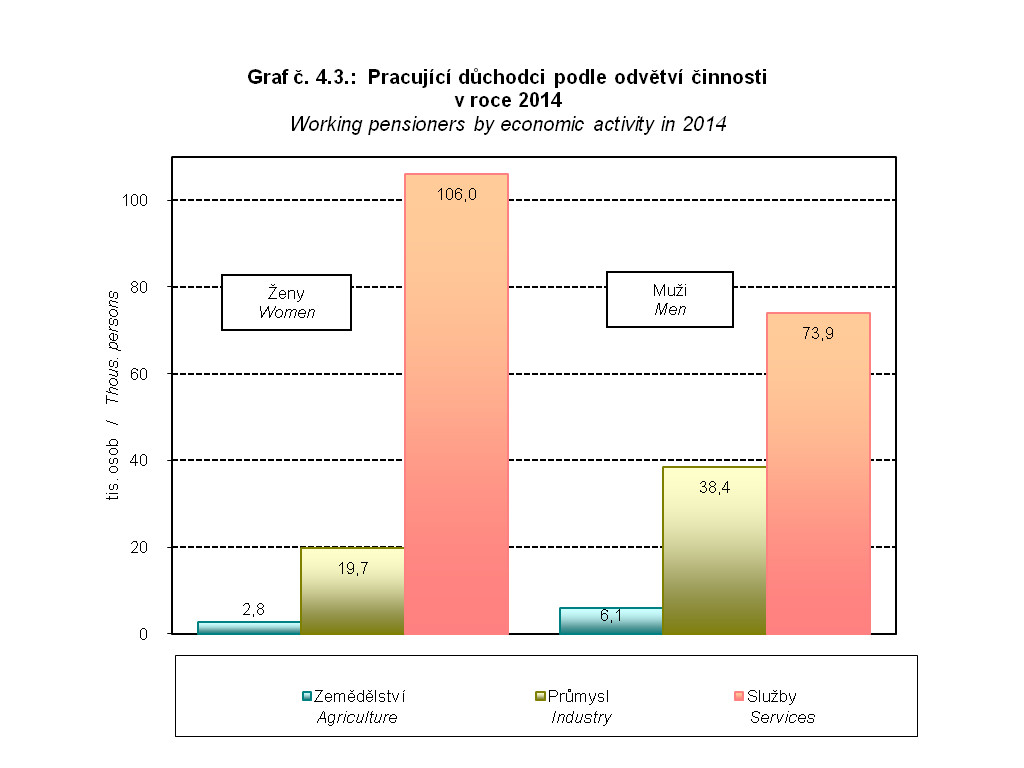
| 4.3. Working pensioners by economic activity in 2014 | JPG |
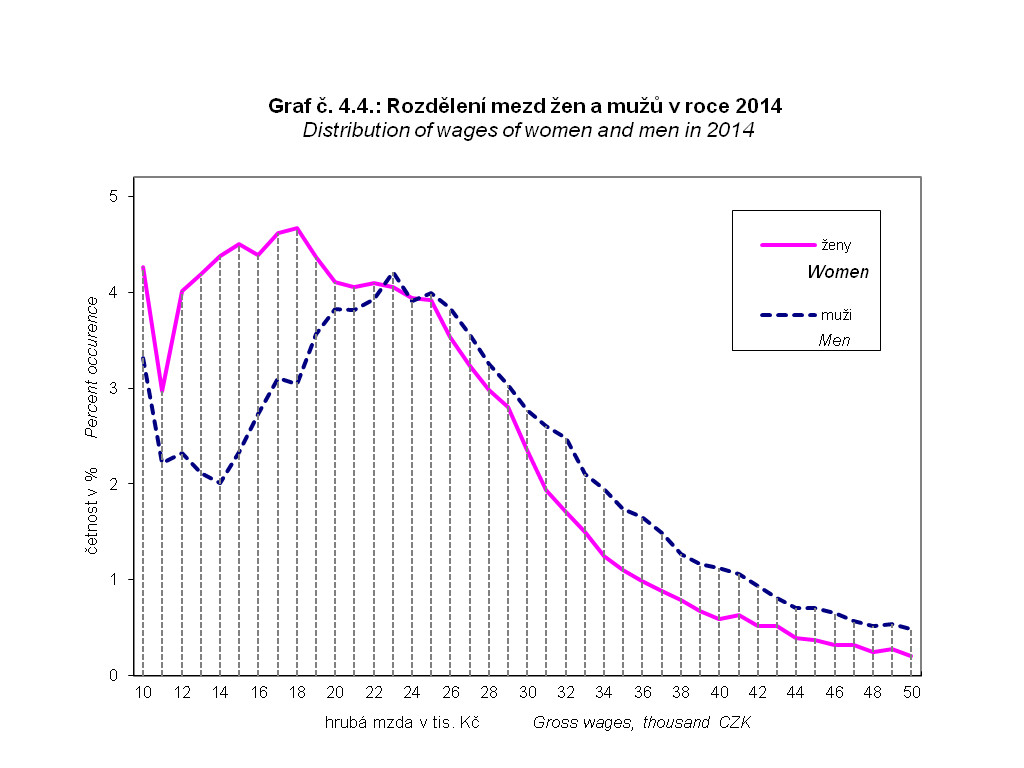
| 4.4. Distribution of wages of women and men in 2014 | JPG |
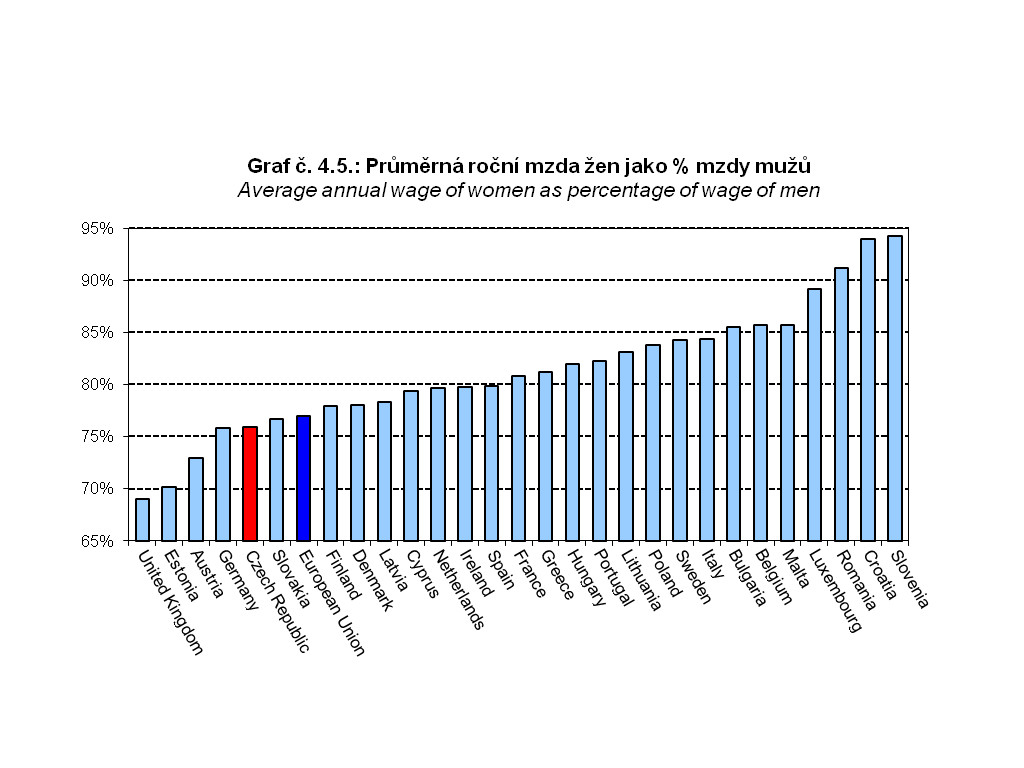
| 4.5. Average annual wage of women as percentage of wage of men | JPG |
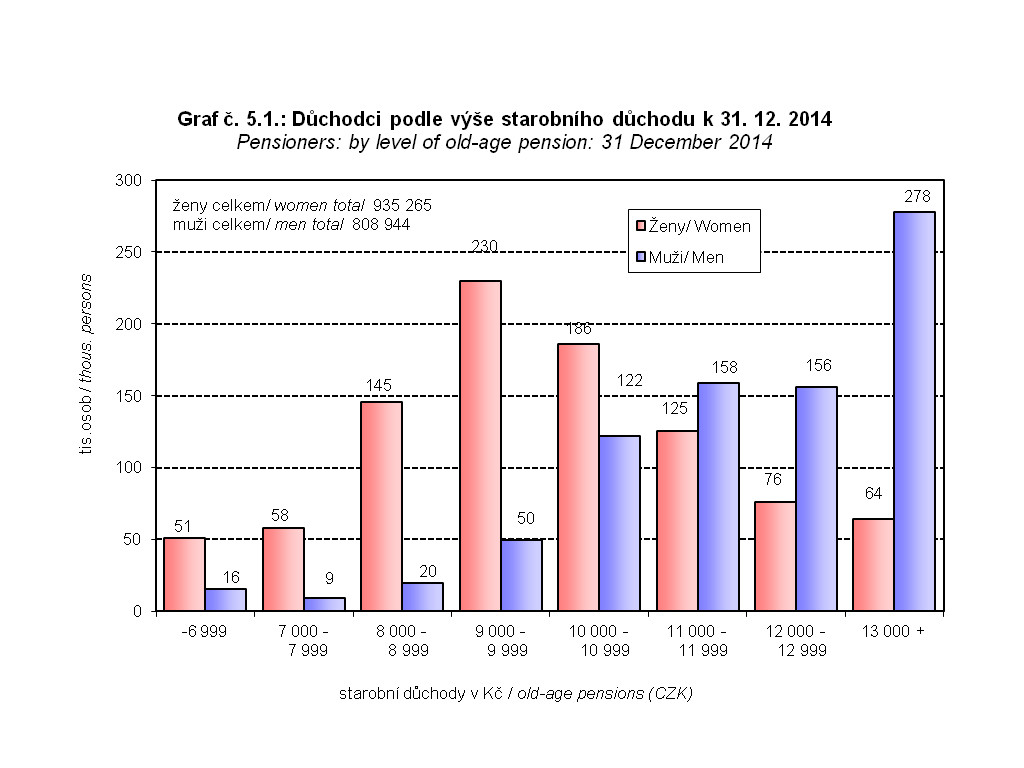
| 5.1. Pensioners: by level of old-age pension: 31 December 2014 | JPG |
| 7.1. Structure of the Senate of the Czech Republic by age and sex: 20 November 2015 | |
| 7.2. Structure of the Chamber of Deputies of the Czech Republic by age and sex: 15 December 2015 | |
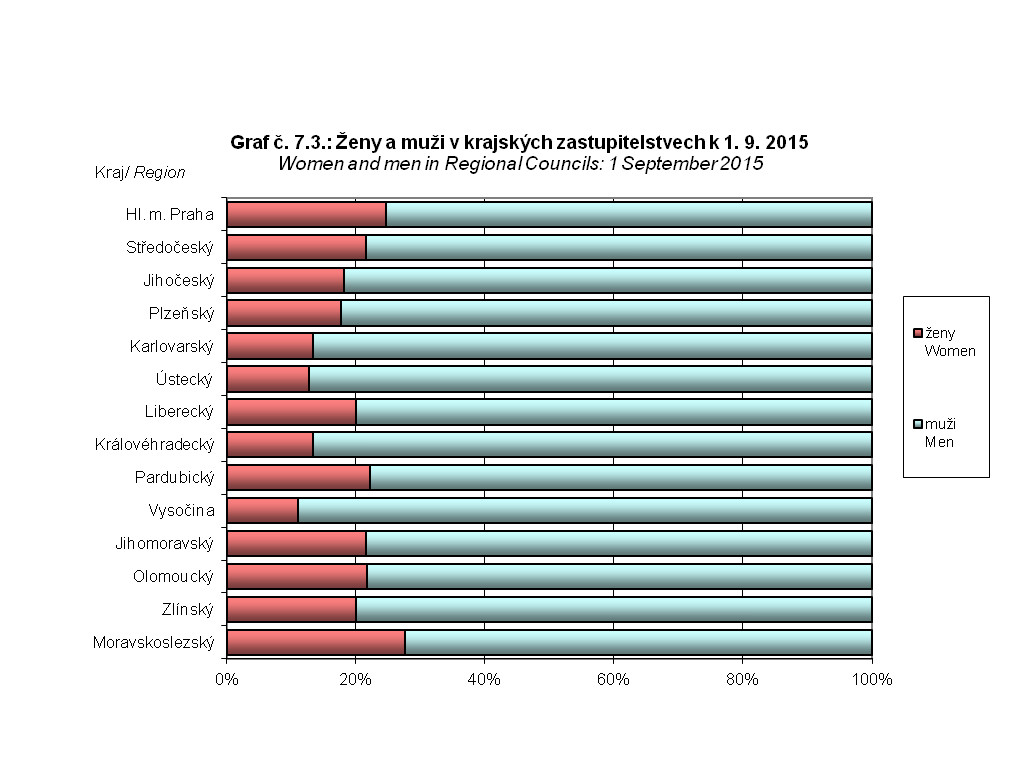
| 7.3. Women and men in Regional Councils: 1 September 2015 | JPG |
| 7.4. Higher and lower positions in the Army of the CR, 15th December, 2015 | JPG |
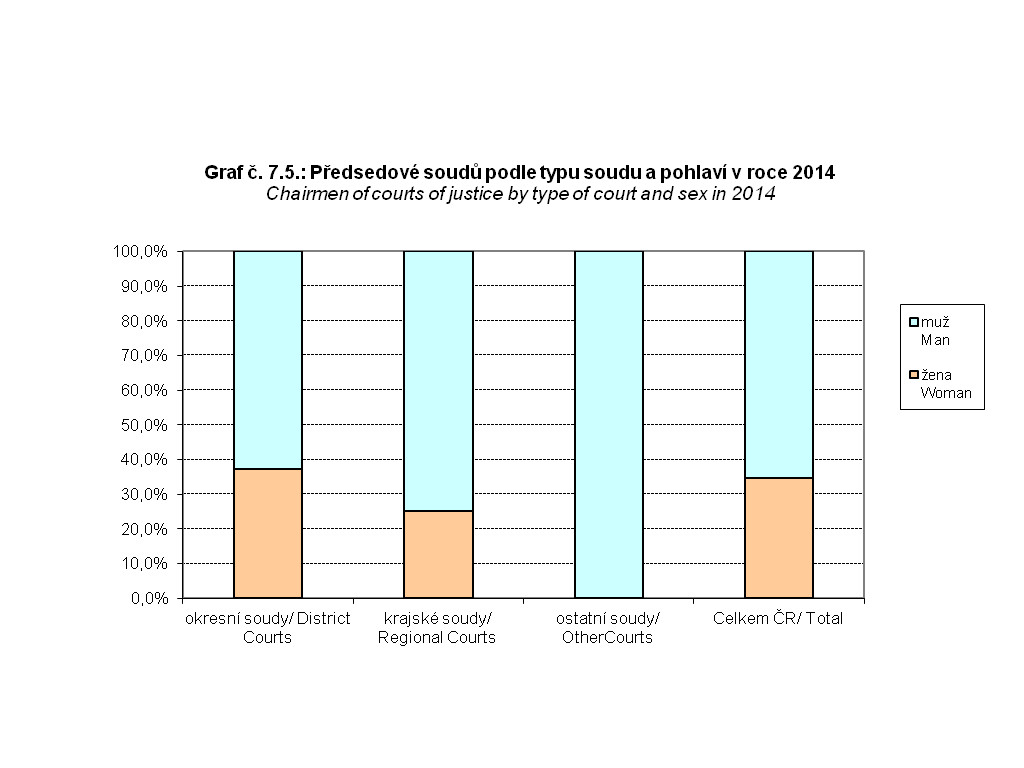
| 7.5. Chairmen of courts of justice by type of court and sex in 2014 | JPG |
| 8.1. Researchers by gender and fields of sciences, 2014 | JPG |
| 8.2. Business enterprise R&D personnel, 2014 | |
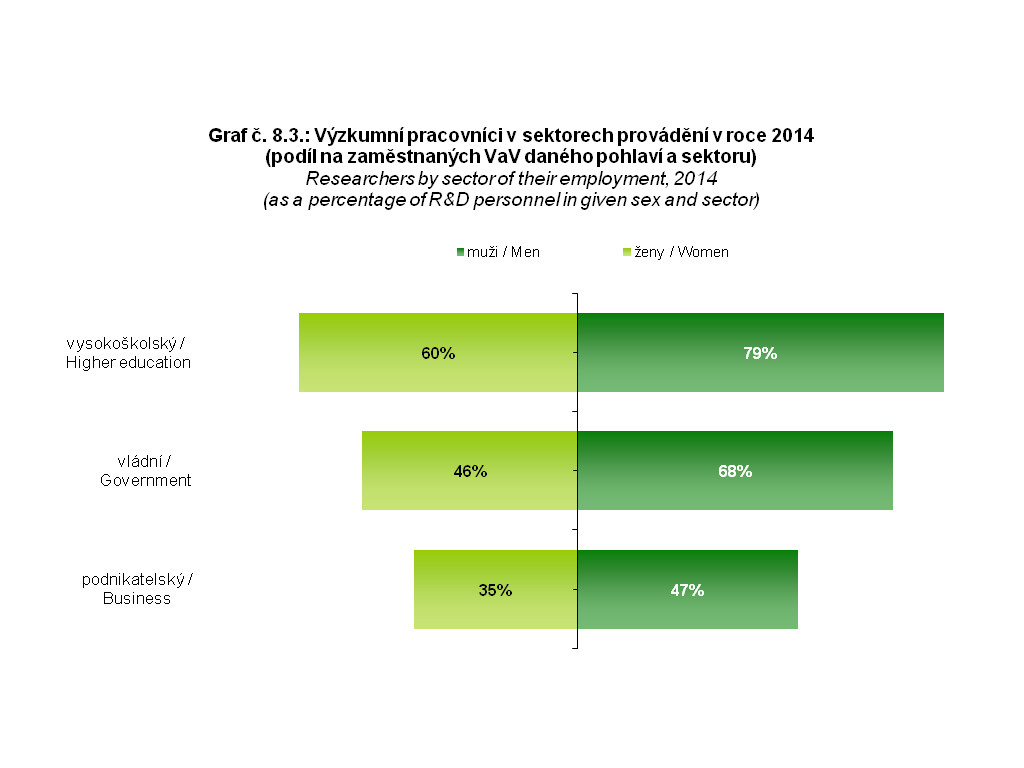
| 8.3. Researchers by sector of their employment, 2014 (as a percentage of R&D personnel in given sex and sector) | JPG |
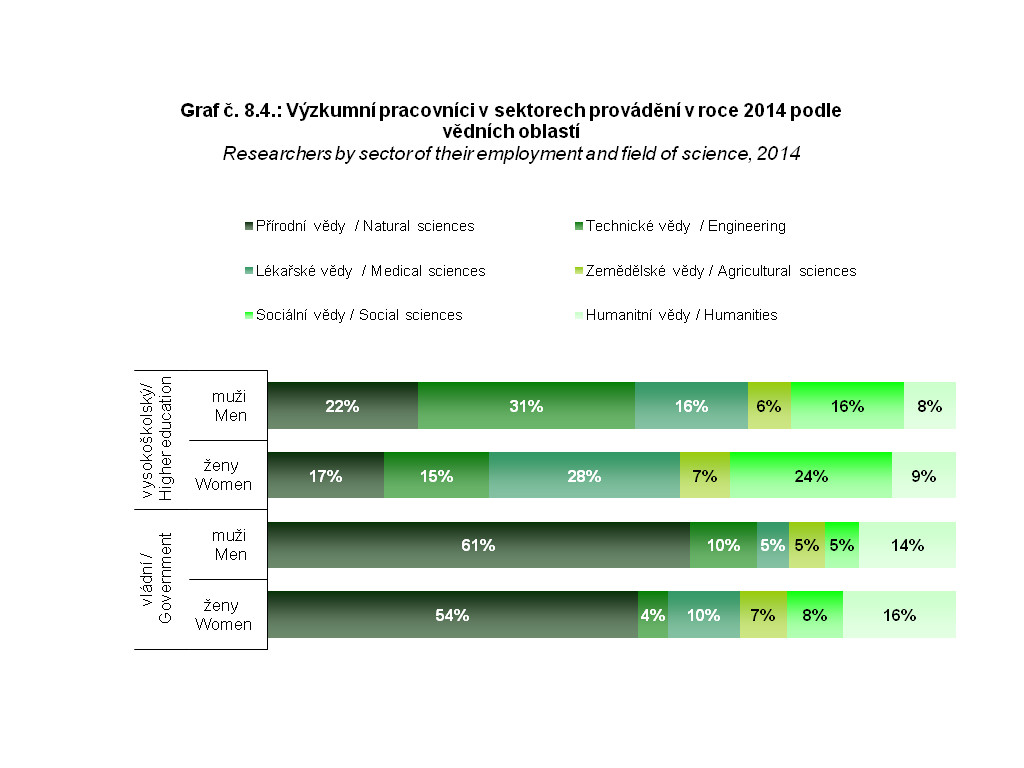
| 8.4. Researchers by sector of their employment and field of science, 2014 | JPG |
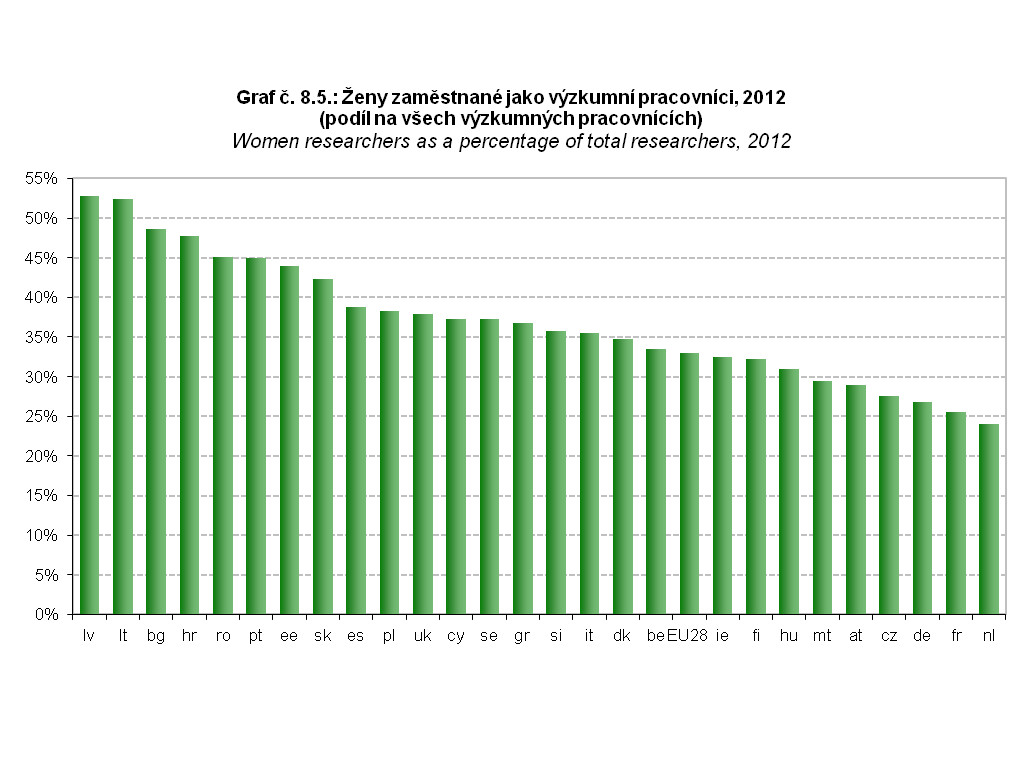
| 8.5. Women researchers as a percentage of total researchers, 2012 | JPG |
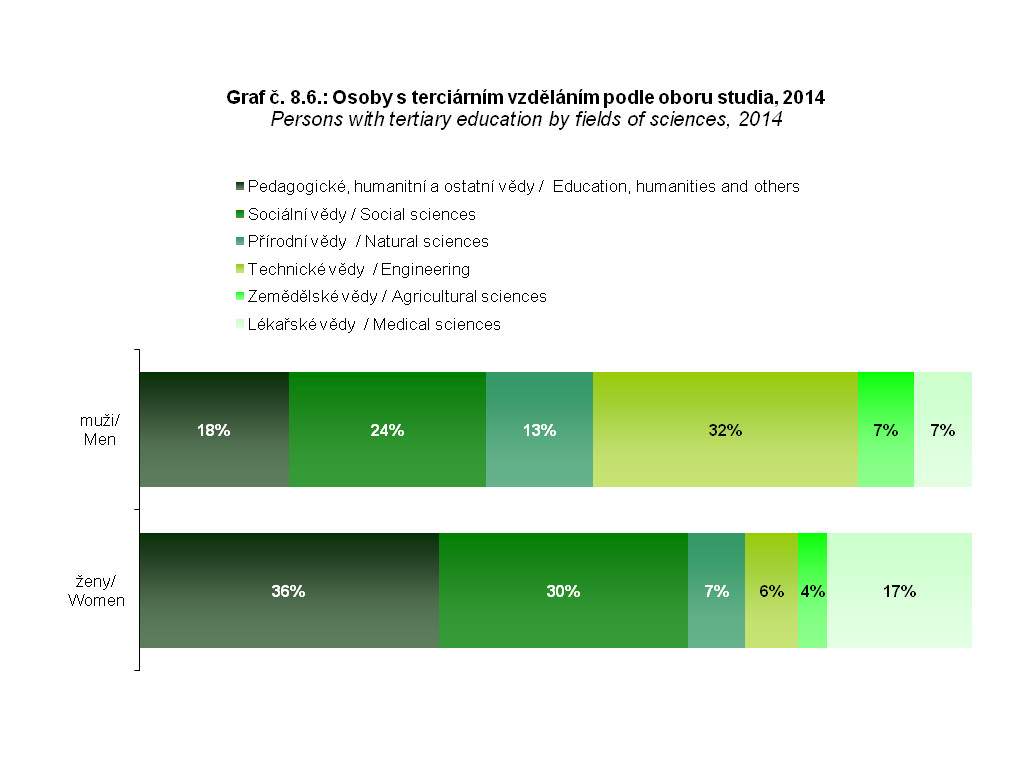
| 8.6. Persons with tertiary education by fields of sciences, 2014 | JPG |
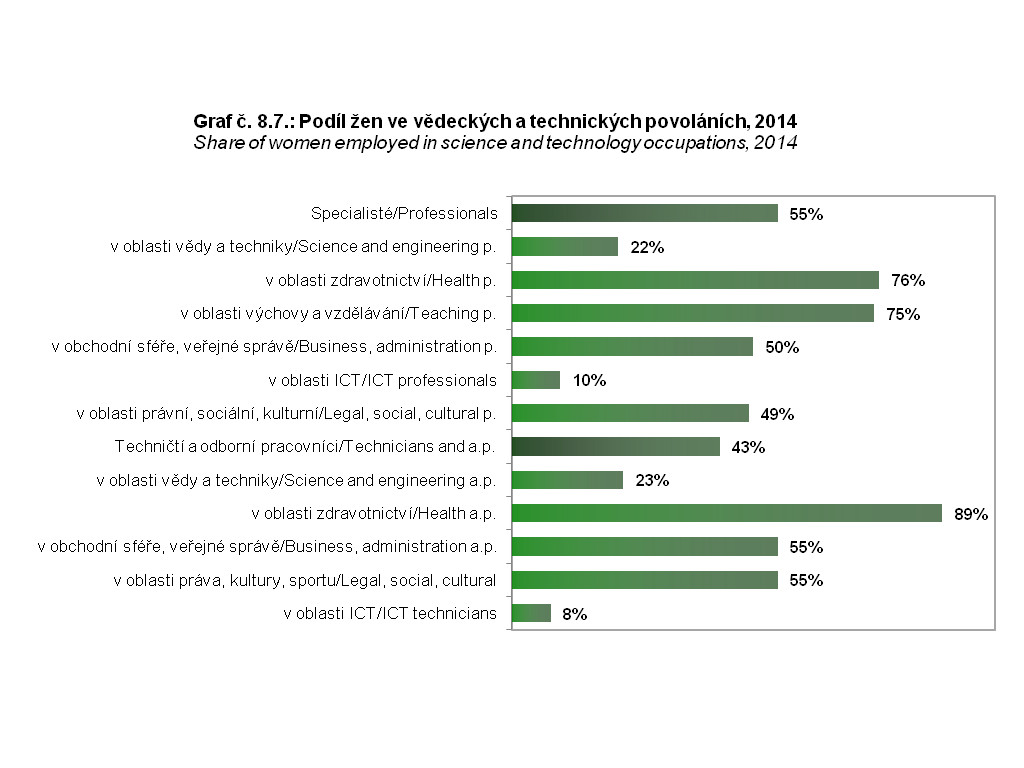
| 8.7. Share of women employed in science and technology occupations, 2014 | JPG |
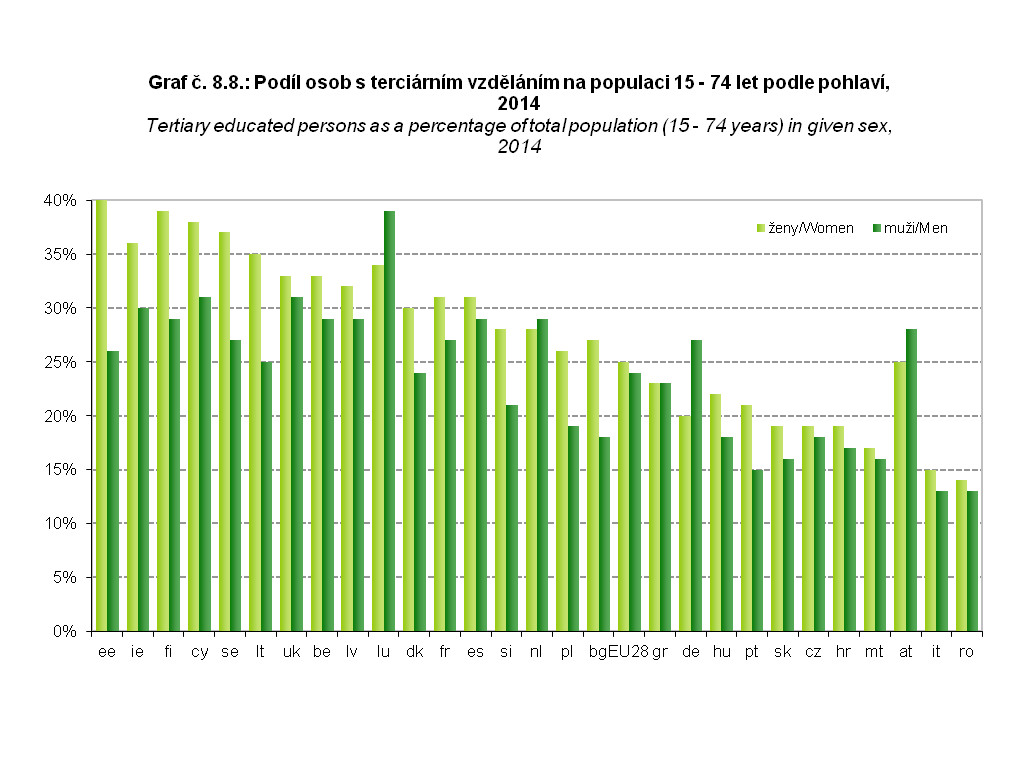
| 8.8. Tertiary educated persons as a percentage of total population (15 - 74 years) in given sex, 2014 | JPG |
| 9.1. Mobile phone users by gender | |
| 9.2. Personal computer users by gender | |
| 9.3. Internet users by gender | |
| 9.4. Using social networking sites | |
| 9.5. Individuals telephoning over the Internet by gender | |
| 9.6. Individuals using the Internet for information search related to travel and accommodation by gender | |
| 9.7. Individuals searching health related information on the Internet by gender and age, 2nd quarter 2015 | |
| 9.8. Reading online news, newspapers, news magazines by gender | |
| 9.9. Individuals using the Internet for listening to web radios by gender and age, 2nd quarter 2015 | |
| 9.10. Individuals using the Internet for online shopping by gender | |
| 9.11. Individuals using Internet banking by gender | |
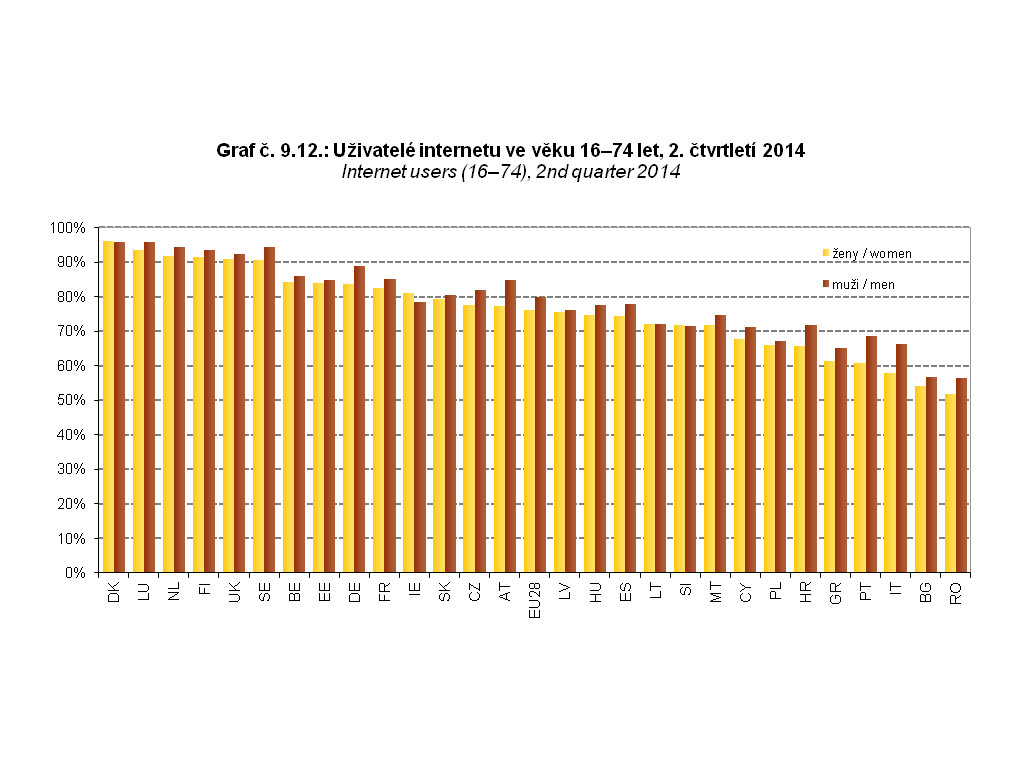
| 9.12. Internet users (16–74), 2nd quarter 2014 | JPG |
| 9.13. IT professionals as a percentage of total employment in given sex, 2014 | JPG |
Published: 31.12.2015
The data are valid as of the release date of the publication.


