
Economic activity of the population - 2nd quarter of 2011
05.08.2011
Code: a-3156-11


The interaction of the demographic development and social and economic conditions of the society has been widely discussed. Simultaneously to the changes to the population age structure great changes to the structure of households occur as well. The Labour Force Sample Survey (LFSS) is a source, which brings fundamental information on changes to the structure of private households (PH), based on joint reimbursement of the household major expenses as food, housing costs, etc.
-
I. Trend in the number of households of persons living alone in 1995 to 2010
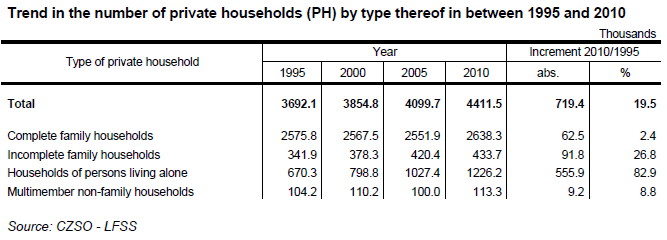
In fifteen years the total number of private households increased by 719 thousand, i.e. by one fifth to 4 411.5 thousand. The number of private households grew fast especially after 2000, in the last decade it has increased by 557 thousand. The trend in the total number of inhabitants is in contrast to the trend in the number of households. In 1995-2010 the population increased by less than 194 thousand, yet the private household number increased almost four times in the same period.
Remark: The approach of private households is more suitable to assess mutual economic relations than the approach of census households (CH), that is based on filiation and relations in between relatives or other relations within one private household. Under the Czech Republic conditions the co-habitation of multiple census households within one private household is of very low incidence – index of the PH/CH ratio attained 98.7% in the 2011 Census, according to the LFSS results this ratio was virtually the same (99%) in 2010. Data on the absolute number of private households, namely households of persons living alone, acquired in the LFSS may not be directly compared to those of the Population and Housing Census. The LFSS is exclusively carried out in flats (dwellings), not in accommodation facilities (collective households) providing long-term social and health care.
While the number of private households grew in total by almost 20%, the largest group of complete family households increased substantially slower (by 2.4% in fifteen years). However, till 2005 their number was virtually stagnating and increased in the last five years due to a rather favourable trend in the birth rate. A number of social factors caused that at a slow growth in the number of complete families the number of incomplete family households of was growing faster. Since 1995 their number increased by over a fourth and the increase in absolute figures is even higher than the increment of complete family households.
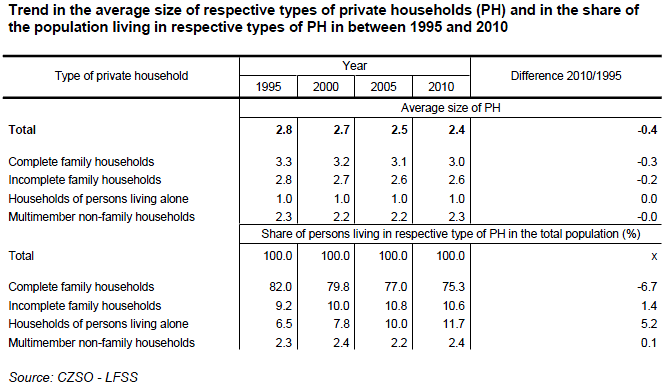
The average size of complete family households as well as incomplete family ones has been permanently decreasing. In the period evaluated the average size of the complete family household declined by 0.3 to 3.0 persons, and that of incomplete family by 0.2 to 2.6 persons. This way merely three quarters of the whole population lived in complete family households due to long-term changes (in 1995 this share still accounted for 82%). There were over 10% of the whole population living in incomplete family households, which number was increasing and average size was falling.
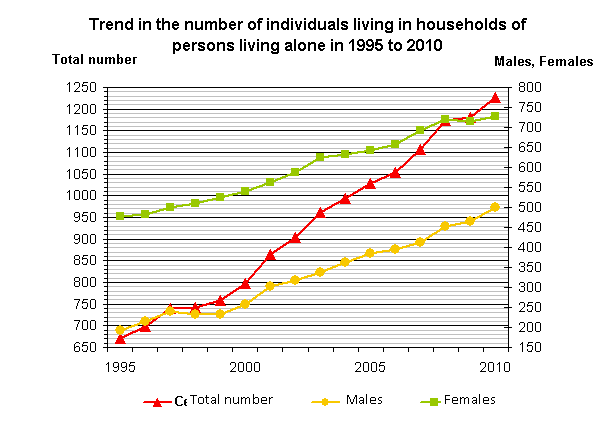
The number of households of persons living alone was the fastest growing by a great margin. Their number has increased by extraordinary 83% in fifteen years.
Source: CZSO - LFSS
Households of persons living alone represented 6.5% of the population in 1995, in 2005 they breached the limit of 10%, and in the last year they already accounted for 12% (11.7 %) of the whole population. If the child component is excluded, the number of individuals living in their own households grew from 8% in 1995 up to 13.6% of the whole population of the group aged 15+ years. These persons are not only managing private households alone, yet mostly also live alone. The difference in the number of dwelling households and private households is very small; the index PH/DH reached mere 1.02 in 2010.
The number of individuals managing household alone in their own households has already exceeded the number of all persons living in incomplete families. The increasing both absolute figure and relative representation of the number of households of persons living alone are not a result solely of the population ageing and prolonged life expectancy but also of more frequent individual household management of the young who in a vast majority live alone in independent housing.
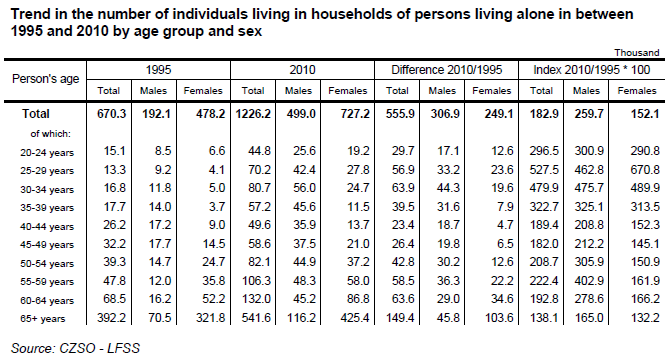
The number of households of persons living alone increased in all age groups of respondents. The total high increment in the number of households of persons living alone over the fifteen-year period was greatly caused by an essential increase in the number of individuals managing households alone in pre-pension and, first of all, pension age. Persons aged 55+ years contributed to the increase by almost a half. The absolutely highest increase of individuals managing households alone was in the age group 65+ years (by almost 150 thousand) and in 2010 it was substantially above the limit of a half million persons (541.6 thousand). The whole group of 65+ years is unambiguously dominated by households of females, who are also by far the most frequent age group (425 thousand) and almost four times outnumber the number of males of the same age.
The increase in the number of households of persons of young and middle productive age plays an important role simultaneously with growing the number of households of persons of pre-pension and pension age. This growth is a result of not merely shifts in the population age structure yet also changes in inter-generation relations, older age limit for setting family, and the total growth of the number of persons, who have chosen such way of life (single households) for various reasons. An enormous increase was demonstrated namely in the group of respondents aged 25-34 years, five times in the monitored period of 1995-2010. The numbers of households of persons living alone of males prevail the numbers of such households of females in all five-year age groups of the young and middle productive age up to 55 years of age.
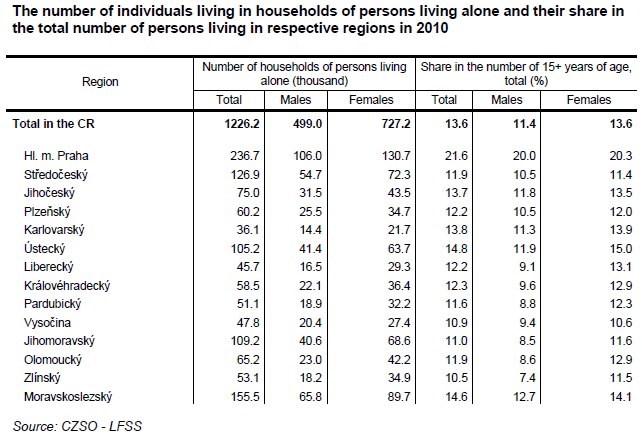
Every fourth private household in the country is household of a person living alone (27.8%). This share does not differ essentially in all regions; it falls within the interval from 23.0% in the Zlínský Region to 29.3% in the Moravskoslezský Region.
If compared to other regions the share of private households of persons living alone is significantly higher in Prague (Hl. m. Praha Region), where it was almost 40% of all private households in Prague in 2010. Thus almost a quarter of these households of persons living alone represents an important factor of life in the Capital City. Virtually every fifth Praguer manages his/her household and lives alone.
Despite the substantial increase in the number of households of persons of younger age the high number of households of persons of pre-pension and pension age exerts the major influence on the structure of households by sex. This wide age zone is definitely dominated by females. Therefore, the share of private households of solitary females in the female population has been still higher than the share of households of solitary males in the total male component of the population in all regions.
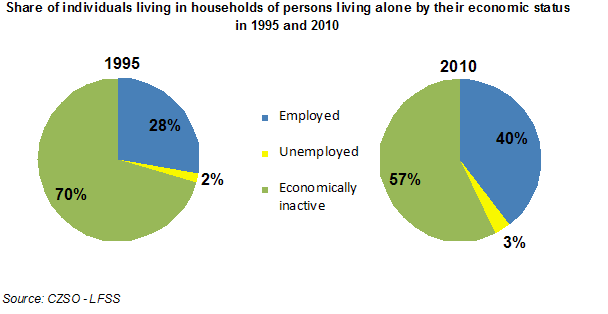
A great increase in single-member households of persons of younger and middle productive ages influenced also a change in the share of respective groups by economic status. Although there are mostly the economically inactive living in these households (increase by 225 thousand in fifteen years), the number of individuals, who have a permanent job, has increased dramatically. Their number increased 2.6 times (by 301 thousand in absolute figure) in fifteen years, that means more than the growth in the number of households of the economically inactive. Yet the number of households of persons living alone who are unemployed increased relatively most culminating in 2005 and 2010, respectively.
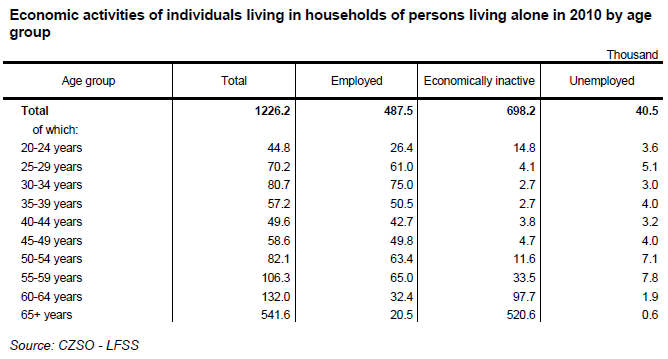
The whole interval of the younger and middle productive ages is dominated by single-member households of persons having jobs. Economically inactive respondents are, moreover, more substantially represented in the group of 20-24 years of age because they mostly undergo preparations for their future occupations at schools and universities. The employed unambiguously dominate the range of 25 and 50 years. After the age of 50 years the number of the economically inactive grows and once the age of 65 years has been attained it counts for over 520 thousand persons.
Concerning households of the unemployed their absolute numbers are not high at all. In the group 25-50 years of age their number is virtually equal to the number of private households of the economically inactive. What deserves to be pointed out is the relatively higher number of quinquagenarians, who manage households alone and are unemployed at the same time. Here the split of partnership may play a role because the social status may be of important influence on the keeping or splitting of partnership.
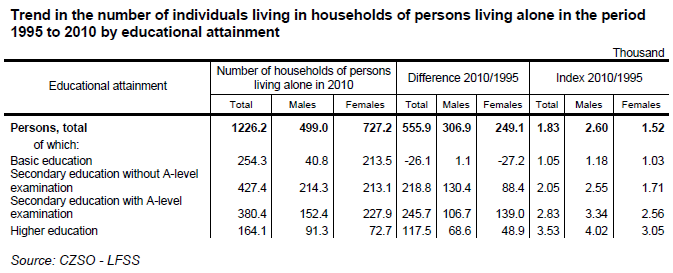
Shifts in the age structure of the population are also connected to great changes to the educational attainment structure of individuals living in households of persons living alone. The total number of persons with basic education has been permanently declining and this has been reflected in the decreased number of households of individuals with educational attainment of ISCED 0-2. The number of private households of individuals with apprenticeship certificates has grown, namely in the middle and higher ages. The highest increase in absolute numbers was recorded for private households of individuals with A-level examination, by almost a quarter of million. The number of private households of university graduates has increased by almost a half of the absolute increment of private households of individuals with A-level examination but if expressed in relative figures the number of private households of university graduates attained three-and-a-half times the number in 1995. The fast growth in the number of persons with higher educational attainment, who live alone, is a result of dramatic changes to the educational attainment structure of the population in the recent fifteen years.
-
II. Structure of private households in selected Member States of the European Union
This year Eurostat released microdata for Q2 2009 for study purposes. The data enable to make assessment of differences in the structure of private households. The CZSO processed these background data for 15 Member States of the European Union.
Results for all Member States could not be compared; the selection does not include the Nordic countries, for instance. The reason is the Nordic countries utilise continuously updated registers of inhabitants. They take numerous data from the identification data, which are subsequently used in the sample surveys themselves. The utilisation of the registers, however, do not enable to construct data for households applying the same methodology as in the case of the standard sample survey, which social and economic characteristics of a respondent can be acquired in relations to other households members from. It follows from experience that in the international comparison the Netherlands is the closest to the Nordic countries. The selection also did not cover states, which reliability of more detailed results is rather limited.
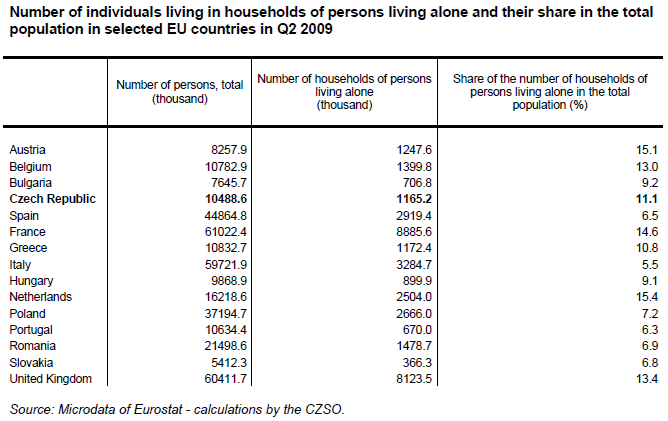
Every tenth inhabitant in the selected Member States lives his/her household alone. The share of these persons in the Czech Republic roughly corresponds to this average. The traditional cohabitation of multiple generations in one private household leads to the share of individuals living in private households of persons living alone is lower than in countries located down South as Italy, Spain, and Portugal, and if compared to the others it is low in Slovakia, Romania, and Poland as well. On the contrary, in the Netherlands, Austria, yet also in France there are 15% of the whole population living in one-member households. It can be rightly assumed that in the Nordic countries the share of persons in these households is at the same level, at least.
If there are substantial differences in the share of private households of persons living alone in the whole population, there are even wider differences in the group of 25-34 years of age. The population of this age has in vast majority finished preparations for future occupations, began to work, and is setting their own private households. The process of becoming independent (putting oneself on owns feet) of the young runs in a much differentiated manner.
In total of the selected countries every eleventh respondent of this ten-year age group lives alone. In the half of the selected countries this share was low, within the range of 2.7% in Slovakia and Bulgaria and 5.4% in Spain and Hungary. In the Netherlands, by contrast, every fifth respondent of the age group 25-34 years lives alone in his/her private household. There are also available data for Norway, a Non-Member State, where over a half (56.4% !) of the population of this age live alone. The share of persons living this way is also high in Austria, Belgium, France, and the United Kingdom.
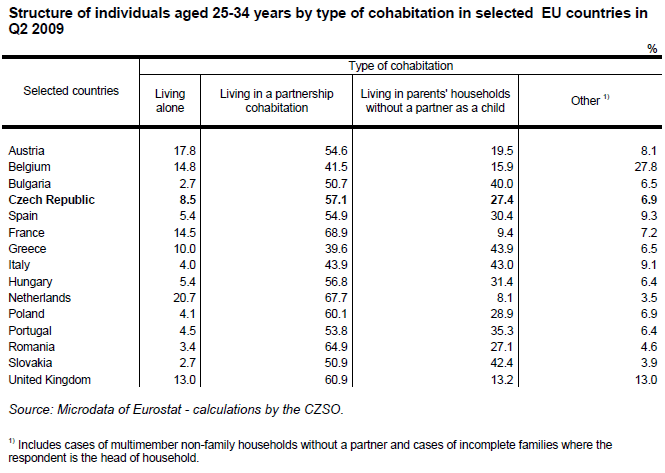
Staying in the parents’ households is not solely a consequence of the traditional inter-generation cohabitation in certain countries yet it is also affected by the way and length of the formal education process. The Netherlands and Nordic countries feature not merely a high share of tertiary education graduates but also a high level of young people’s employment rate. In these countries the young aged 20-24 years work very often. It is clear that the process of becoming independent is essentially affected by the respondent economic conditions if the respondent is employed and if the amount of his/her available finances enables to set his/her own private household at all.
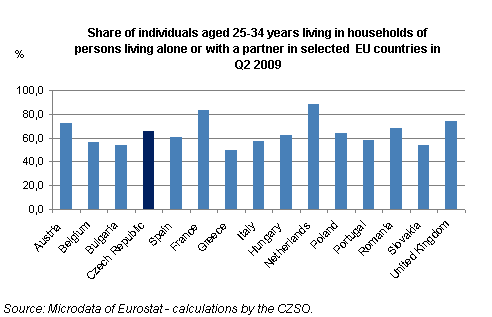
If cases of persons in partnership cohabitations are considered then there is 88% of the Netherlanders in the age group 25-34 years living in his/her own household either alone or in a partnership, yet in Bulgaria, Greece and Slovakia there was solely a half of the young of this age group living this way.
The level of independence is mirrored in the share of the aged 25-34 years, who still live with their parents in the child position. While there is solely every twelfth Netherlander living in the households of his/her parents, or one parent, on the other hand, in Italy, Greece, Slovakia, and Bulgaria there were over 40% of this young population living this way. The Czech Republic is around the average of the sample of countries.
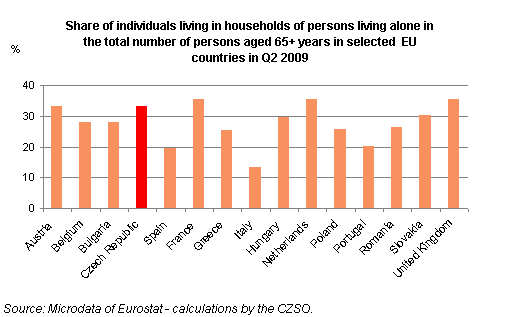
Concerning the elderly, the share of households of persons living alone in this age group in the Czech Republic is markedly higher than the average of the selected countries. One third of all persons, who attained age 65+ years in 2009, lived alone in households in the Czech Republic. This figure is nearing the highest share of the elderly living alone in France and the Netherlands (35.5%). This share, however, reaches mere 13.4% in Italy, and it is on the level of sole 20% in Spain and Portugal. It is doubtless that in these countries, but also in Greece, Bulgaria, Belgium, Romania, and in Poland of the up North located countries, the cohabitation of the older generation with the younger one is more frequent that in other Member States of the European Union. Here the different life expectancy of persons in the respective countries probably demonstrates its effects as well.
The process of the population ageing has been evinced at various intensity in all European countries. Therefore it is necessary to ensure needed capacities of organisations providing health and, first of all, social services to the elder generations. Employment in health and social services differs greatly; in the Czech Republic it is substantially lower than in majority of Western European countries. If in 2009 in the Czech Republic there were, for instance, four times more persons employed in manufacturing than in health and social services, in seven countries, on the contrary, more persons had jobs in health and social services than in the whole manufacturing. And this fact does not hold for countries with undeveloped industry. These countries involve, inter alia, all the Nordic countries, including Denmark, yet also the United Kingdom and the Netherlands. The potential to provide for intergeneration care is in longer prospect better in all these countries also for the reason that their current fertility rates are highest, along with France and Belgium, in the whole European Union.
* * * * *
The whole monitored period of 1995-2010 is characteristic for a fast growth in the number of private households of persons living alone, in which there were 14% of the Czech Republic population aged 15+ years living in the last year. The share of these households is extremely high in Prague where 22% of Praguers aged 15+ years lived alone last year. The growing trend in the total number of persons living alone is caused not solely by the population ageing but also by other social and economic factors.
Over a half of individuals living in households of persons living alone has attained sixty years of age, at least. The group is dominated by females, who already terminated their economic activities. Yet the number of households of persons living alone of individuals of the young productive age from 20 to 40 years was growing relatively much faster. Thus an important portion of the population of this age manages and in vast majority lives alone. Last year this number accounted already for a quarter of million persons; that was four times more than in 1995.
The growth in the number of households of persons living alone is obvious in all European countries. Yet differences among the countries are significant. It follows from data provided by Eurostat that the level of independence of the young is markedly high in certain countries of the Northern and Western Europe. In Eastern Europe and in majority of countries located down South, on the contrary, the young people more frequently live in households of their parents.
Attachments
Archive:
- year 2017 | 4th quarter of 2017 | 3rd quarter of 2017 | 2nd quarter of 2017 | 1st quarter of 2017
- year 2016 | 4. quarter of 2016 | 3. quarter of 2016 | 2. quarter of 2016 | 1. quarter of 2016
- year 2015 | 4. quarter of 2015 | 3. quarter of 2015 | 2. quarter of 2015 | 1. quarter of 2015
- year 2014 | 4 quarter 2014 | 3 quarter 2014 | 2 quarter 2014 | 1 quarter 2014
- year 2013 | 4th quarter of 2013 | 3rd quarter of 2013 | 2nd quarter of 2013 | 1st quarter of 2013
- year 2012 | 4th quarter of 2012 | 3rd quarter of 2012 | 2nd quarter of 2012 | 1st quarter of 2012
- year 2011 | 4th quarter of 2011 | 3rd quarter of 2011 | 2nd quarter of 2011 | 1st quarter of 2011
Show all
Hide
Published: 05.08.2011
The data are valid as of the release date of the publication.
Contact: Information Services Unit - Headquarters, tel.: +420 274 056 789, email: infoservis@czso.cz


