
Business cycle survey - July 2010
Increase in confidence of entrepreneurs and consumers
26.07.2010
Code: r-1201-10


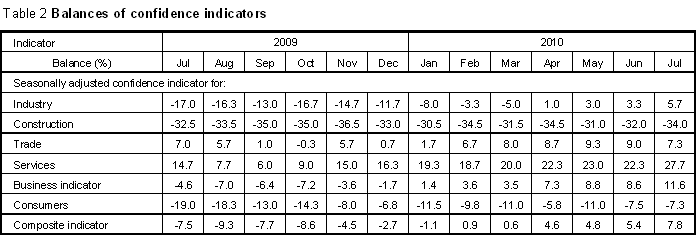
Confidence in domestic economy increased m-o-m in July. The composite confidence indicator (economic sentiment indicator) increased by 2.4 points. Confidence of entrepreneurs increased, namely in industry and selected services. Confidence of consumers increased slightly as well (by 0.2 point), m-o-m. Compared to a low value in July 2009, the composite confidence indicator is 15.3 points up.
* * *
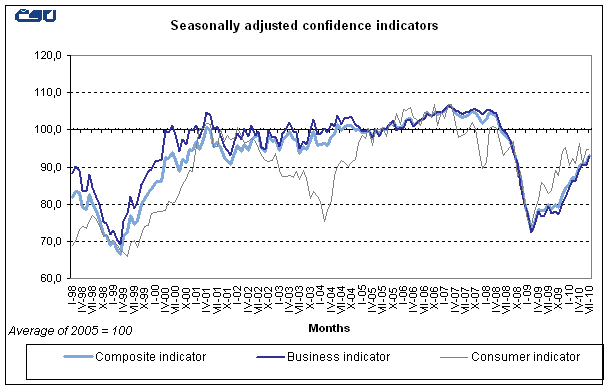
Business confidence indicator increased by 3 points in July compared to June. Among entrepreneurs, confidence increased in industry and in selected services; in construction and trade it decreased. Compared to low values in the last year, the confidence of entrepreneurs is 16.2 points up.
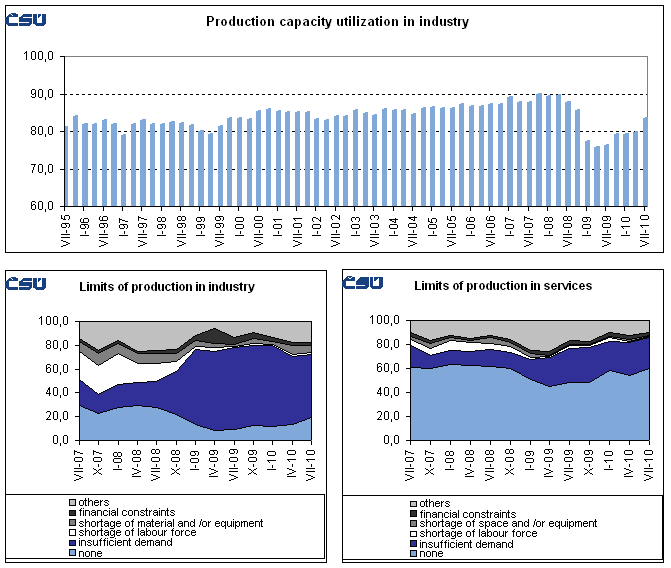
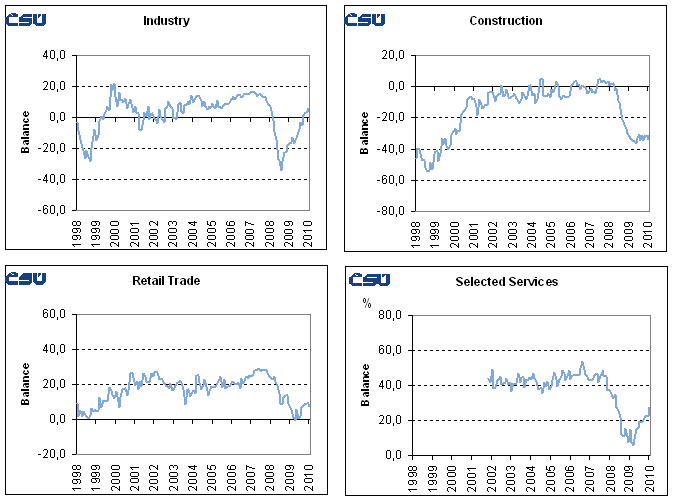
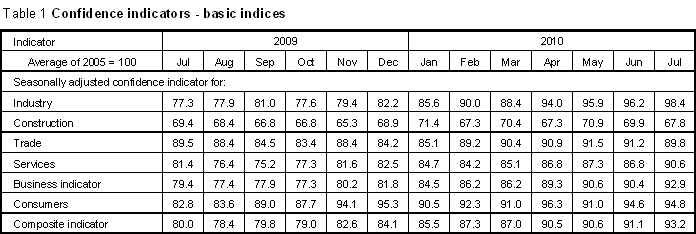
In industry, the assessment of current overall economic situation in July increased compared to June as well as the assessment of total demand. Production capacity utilization in manufacturing industry increased in July too and reached 81.9%. Respondents estimate they have work secured by contracts for 8.1 months ahead. Most important barrier of production still is insufficient demand, even though compared to previous quarter it is stated by less respondents (52.8%). According to respondents, stocks hardly changed. For next three months, respondents expect increase in production activity by steady employment. Expectations of general economic situation for the next three as well as six months are higher than in June. Overall, in July, the confidence in industry increased by 2.4 points, m-o-m; compared to low values in last year it is 22.7 points up.
In construction, the assessment of current economic situation improved markedly in July compared to June. Assessment of total demand decreased. For the period of the next three months respondents expect an improvement of construction activity by unchanged employment, compared to June. Respondents estimate that they have work secured by contracts for 9 months ahead. Expectations of the economic situation development for the next three months are lower than in June, for next six months they are higher. Overall, the confidence in construction decreased by 2 points, m-o-m, due to low demand and it is 1.5 point down, y-o-y.
In trade, the assessment of current economic situation in July increased slightly, compared to June. According to respondents, in July, the finished goods stocks increased. Expectations of the economic situation development for the period of the next three months are slightly lower than in June, for next six months they are slightly higher. In general, the confidence in trade decreased by 1.7 points, m-o-m, and it is 0.3 point up y-o-y.
In selected services, according to respondents, the assessment of current economic situation and the assessment of demand increased markedly in July compared to June. Expectations of demand for the next three months decreased. For the period of the next three as well as six months expectations of total economic situation are the same as in June. Most important barrier of production remains, in spite of a decrease compared to last quarter, insufficient demand (25.9% of respondents say). Overall, the confidence in selected services increased by 5.4 points, compared to June; while in the y-o-y comparison it is 13 points up.
Consumer confidence indicator increased by 0.2 point compared to June, to be 11.7 points up, compared to low value in July 2009. The survey taken among consumers in July indicates that consumers expect for the next twelve months a slight decrease in the overall economic situation and in their own financial standing. The share of respondents expecting rises in unemployment did not change in July. The percentage of respondents planning to save money increased.
Seasonally adjusted confidence indicators
Note
Contact: Marie Hörmannová, phone (+420) 274052049,
e-mail: marie.hormannova@czso.cz
Data source: CZSO business survey, GfK Praha consumer survey
Business and Consumers Surveys are co-financed by grant agreements
of the European Commission DG ECFIN
End of data collection: 19 July 2010
End of data processing: 22 July 2010
Related publication: 1201-10 Business Cycle Survey in Enterprises of Industry, Construction,
Trade and Selected Services
(Publications available also at /csu/czso/katalog-produktu )
Methodological explanatory notes :
Since May 2010, the results are in compliance with the programme of business and consumer surveys in the EU processed according to the new CZ-NACE classification (national version of NACE Rev. 2), which replaced the former classification CZ-NACE (OKEČ, the national version of NACE Rev. 1.1). The changes apply to all data except the consumer confidence indicator. Exhaustive information on the introduction of this classification is available at: /csu/czso/klasifikace_ekonomickych_cinnosti_-cz_nace- . The whole time series are recalculated back, data are comparable and available at /csu/czso/kpr_ts .
Since January 2009, the composite confidence indicator (economic sentiment indicator) is in compliance with the EU methodology presented as a weighted average of seasonally adjusted confidence indicators in industry, construction, trade, selected services and seasonally adjusted consumer confidence indicator . Composite business confidence indicator is a weighted average of seasonally adjusted confidence indicators in industry, construction, trade and selected services.
Since January 2006, due to the inclusion of confidence indicator in selected services, a new weighting system has been used : confidence indicator in industry is assigned the weight of 40%, in construction and trade 5% each, in services 30%, and consumer confidence indicator is assigned the weight of 20%. Indicators are presented as basic indices, the base being the average of 2005. Time series of composite and business confidence indicator are recalculated, using the new weighting system – back to May 2002 (the beginning of the business cycle survey in selected services). The whole time series of base indices are then re-based to the average of 2005; the data are comparable.
Text not edited for language.
Archive:
- year 2024 | April 2024 | March 2024 | February 2024 | January 2024
- year 2023 | December 2023 | November 2023 | October 2023 | September 2023 | August 2023 | July 2023 | June 2023 | May 2023 | April 2023 | March 2023 | February 2023 | January 2023
- year 2022 | December 2022 | November 2022 | October 2022 | September 2022 | August 2022 | July 2022 | June 2022 | May 2022 | April 2022 | March 2022 | February 2022 | January 2022
- year 2021 | December 2021 | November 2021 | October 2021 | September 2021 | August 2021 | July 2021 | June 2021 | May 2021 | April 2021 | March 2021 | February 2021 | January 2021
- year 2020 | December 2020 | November 2020 | October 2020 | September 2020 | August 2020 | July 2020 | June 2020 | May 2020 | April 2020 | March 2020 | February 2020 | January 2020
- year 2019 | December 2019 | November 2019 | October 2019 | September 2019 | August 2019 | July 2019 | June 2019 | May 2019 | April 2019 | March 2019 | February 2019 | January 2019
- year 2018 | December 2018 | November 2018 | October 2018 | September 2018 | August 2018 | July 2018 | June 2018 | May 2018 | April 2018 | March 2018 | February 2018 | January 2018
- year 2017 | December 2017 | November 2017 | October 2017 | September 2017 | August 2017 | July 2017 | June 2017 | May 2017 | April 2017 | March 2017 | February 2017 | January 2017
- year 2016 | December 2016 | November 2016 | October 2016 | September 2016 | August 2016 | July 2016 | June 2016 | May 2016 | April 2016 | March 2016 | February 2016 | January 2016
- year 2015 | December 2015 | November 2015 | October 2015 | September 2015 | August 2015 | July 2015 | June 2015 | May 2015 | April 2015 | March 2015 | February 2015 | January 2015
- year 2014 | December 2014 | November 2014 | October 2014 | September 2014 | August 2014 | July 2014 | June 2014 | May 2014 | April 2014 | March 2014 | February 2014 | January 2014
- year 2013 | December 2013 | November 2013 | October 2013 | September 2013 | August 2013 | July 2013 | June 2013 | May 2013 | April 2013 | March 2013 | February 2013 | January 2013
- year 2012 | December 2012 | November 2012 | October 2012 | September 2012 | August 2012 | July 2012 | June 2012 | May 2012 | April 2012 | March 2012 | February 2012 | January 2012
- year 2011 | December 2011 | November 2011 | October 2011 | September 2011 | August 2011 | July 2011 | June 2011 | May 2011 | April 2011 | March 2011 | February 2011 | January 2011
- year 2010 | December 2010 | November 2010 | October 2010 | September 2010 | August 2010 | July 2010 | June 2010 | May 2010 | April 2010 | March 2010 | February 2010 | January 2010
Show all
Hide
Published: 26.07.2010
The data are valid as of the release date of the publication.
Contact: Information Services Unit - Headquarters, tel.: +420 274 056 789, email: infoservis@czso.cz


