Analysis - Consumer price indices - 3rd quarter of 2011
10.10.2011
Code: a-7155-11
Consumer prices increased by 0.1% in Q3 2011 compared with Q2 2011; market prices were down by 0.2% and regulated prices * ) rose by 1.4%. The quarter-on-quarter (q-o-q) price level increase was affected especially by a price increase in 'recreation and culture', 'housing, water, electricity, gas and other fuels', 'alcoholic beverages and tobacco'. A contrary effect on the price level came primarily from 'alcoholic beverages and tobacco' and 'clothing and footwear'.
The rise in prices in 'recreation and culture' owed to a seasonal summer increase in prices of package holidays by 11.3%. In 'housing, water, electricity, gas and other fuels', prices of natural gas went up by 7.0%. Prices of alcoholic beverages and tobacco were higher (1.0% and 1.1%, respectively).
The drop in food prices came primarily from a marked price reduction of vegetables by 22.1% and fruit by 8.1%, but prices for other kinds of food had rather growing tendency. Prices of clothing and footwear were affected mainly by action discounts on summer kinds of clothing and footwear .
The average month-on-month (m-o-m) growth rate in Q3 2011 was -0.1% (the same as in Q3 2010).
Consumer price indices
the previous quarter = 100
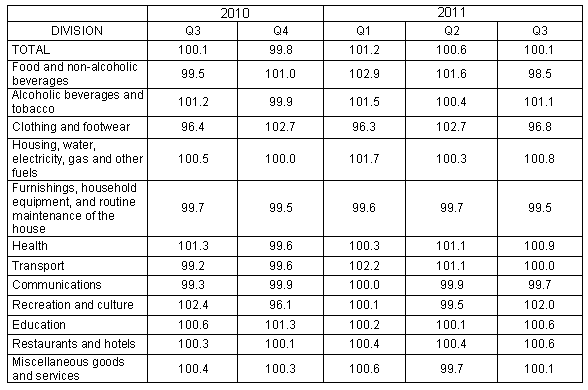
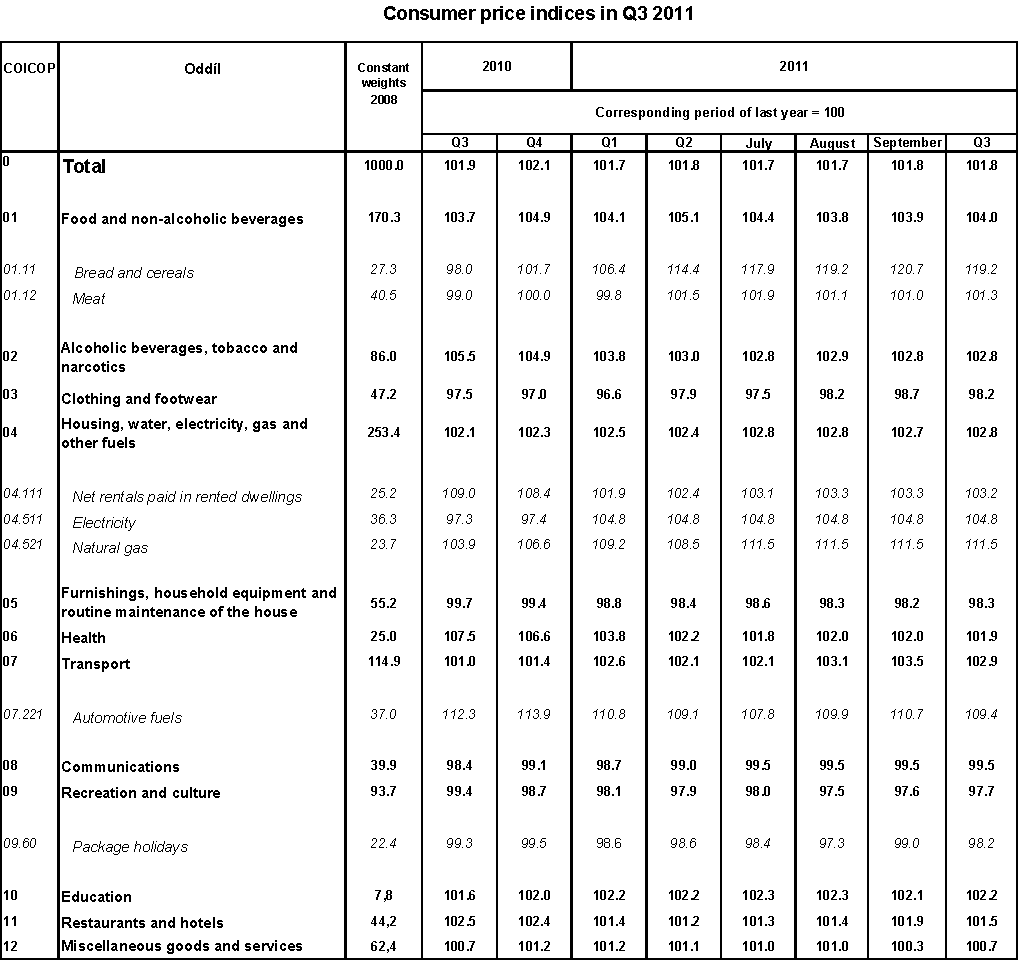
Consumer prices increased by 1.8% in Q3 2011 compared to Q3 2010, i.e. the same as in Q2 2011. Although the year-on-year growth of the overall consumer price level was the same in Q2 and Q3 2011, the price development of some items was in varying degrees different. Prices in 'food and non-alcoholic beverages', 'health' and 'miscellaneous goods and services' increased at a slower pace. On the contrary, faster growth than in Q2 was recorded for prices in 'housing, water, electricity, gas and other fuels', 'transport' and 'restaurants and hotels'.
The growth of market prices slowed down to 1.2% (from 1.3% in Q2) and the rise in regulated prices accelerated to 4.5% (from 4.0% in Q2).
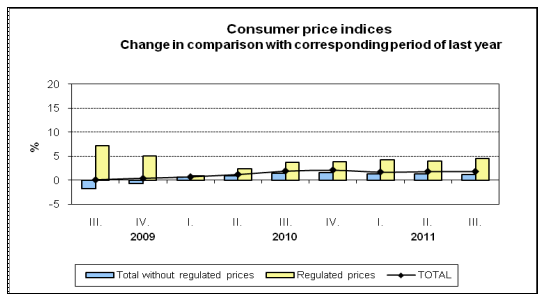
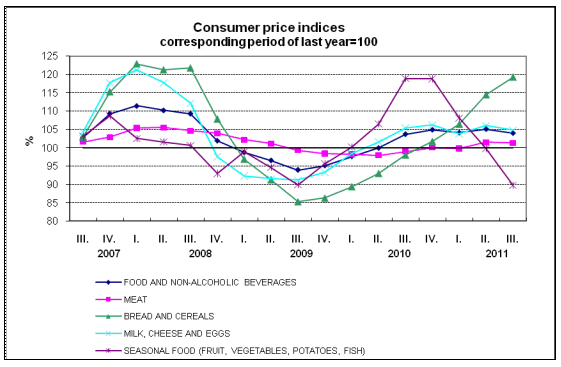
A slowdown of price increase in 'food and non-alcoholic beverages' was influenced particularly by prices of vegetables and fruit, which were lower year-on-year (-16.3% and -5.9%, respectively). A steep fall in y-o-y indices of seasonal goods in this year is evident from the graph below. A slowdown in the price rise came also from the development of prices in Q3 in the previous year, when there was an increase in prices of some items. It was reflected in oils and fats, where the rise in prices of butter eased to 10.8% in Q3 (from 19.6% in Q2). On the other hand, the increase in prices of bread and cereals accelerated due to higher prices of bread by 24.7% (15.1% in Q2) and prices of rolls and baguettes by 35.5% (29.0% in Q2). The high y-o-y growth of prices (from 10% to 40%) continued for flour, milk, cooking oils, vegetable fats, sugar, cocoa and coffee.
In 'recreation and culture', despite a strong q-o-q price growth of package holidays (which was similar to last year) their prices remained lower by 1.8%. Prices of holidays increase markedly every year, month-on-month, in July and August (although with different variances) due to the summer season, and afterwards they return in September to their basic level from June. Prices of audio-visual, photographic and information processing equipment were also lower than in the previous year (-11.8%).
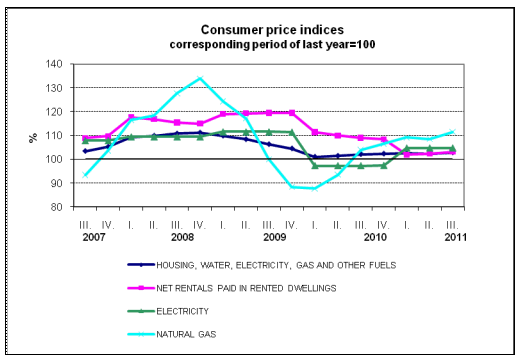
In 'housing, water, electricity, gas and other fuels', the acceleration of y-o-y price growth came from prices of natural gas, which were higher by 11.5% (8.5% in Q2). This acceleration owed to an increase in prices of natural gas since June and July this year. Electricity prices rose by 4.8% (the same as in Q1 and Q2). The net actual rentals increased by 3.2% (from 2.4% in Q2), of which for dwellings with regulated rentals were higher by 8.8% and for dwellings with market rentals by 0.8%.
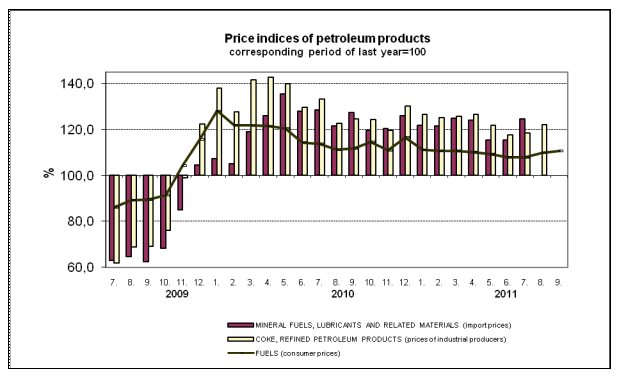
A moderate acceleration of the price rise was shown also in 'transport' due to both higher fuel prices and mitigation of the decline in car prices. Prices of transport services increased by 1.7% (from 0.9% in Q2). Prices of automotive fuel rose by 9.4% in Q3 2011, year-on-year (9.1% in Q2). Car prices reduced their drop to 3.5% (from 4.8% in Q2). The development in consumer fuel prices in relation to industrial producer prices and import prices of petroleum products is shown in the following graph.
The year-on-year drop in prices, which, however, in Q3 slowed down, continued in clothing and also mobile phones and services of mobile operators. Conversely, the y-o-y decrease deepened at prices of device and household appliances.
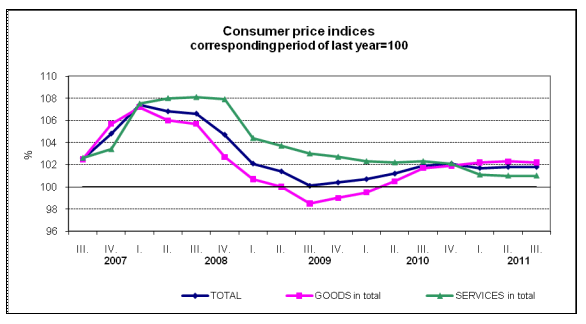
Prices of goods in total rose by 2.2% (2.3% in Q2) and prices of services went up by 1.0% (the same as in Q2). The graph shows that prices of services grew more slowly than prices of goods in 2011.
Harmonized index of consumer prices in the EU27
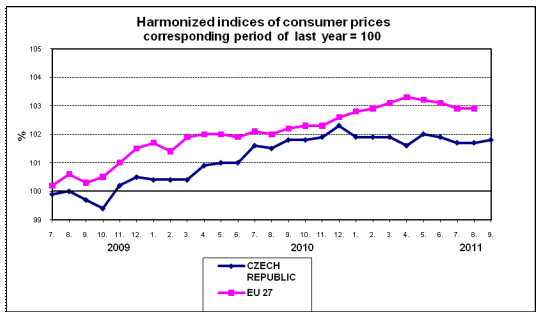
The y-o-y increase in the average harmonized index of consumer prices (HICP) of the EU27 was according to preliminary data released by Eurostat 2.9% in July and August. In the Czech Republic, these values were in the same months 1.9% and 2.1%. According to preliminary data, the increment of HICP was in the Czech Republic in September the same as in August, i.e. 2.1%. The chart below shows that the annual HICP in the Czech Republic was lower for a long term than the average HICP in the EU27 and their difference increased slightly in 2011.
*) Goods and services prices of which are partly or entirely regulated.
Archive:
- year 2024 | 1. quarter of 2024
- year 2023 | 4. quarter of 2023 | 3. quarter of 2023 | 2. quarter of 2023 | 1. quarter of 2023
- year 2022 | 4. quarter of 2022 | 3. quarter of 2022 | 2. quarter of 2022 | 1. quarter of 2022
- year 2021 | 4. quarter of 2021 | 3. quarter of 2021 | 2. quarter of 2021 | 1. quarter of 2021
- year 2020 | 4th quarter of 2020 | 3rd quarter of 2020 | 2nd quarter of 2020 | 1st quarter of 2020
- year 2019 | 4. quarter of 2019 | 3. quarter of 2019 | 2. quarter of 2019 | 1. quarter of 2019
- year 2018 | 4. quarter of 2018 | 3. quarter of 2018 | 2. quarter of 2018 | 1. quarter of 2018
- year 2017 | 4th quarter of 2017 | 3rd quarter of 2017 | 2nd quarter of 2017 | 1st quarter of 2017
- year 2016 | 4. quarter of 2016 | 3. quarter of 2016 | 2. quarter of 2016 | 1. quarter of 2016
- year 2015 | 4. quarter of 2015 | 3. quarter of 2015 | 2. quarter of 2015 | 1. quarter of 2015
- year 2014 | 4 quarter 2014 | 3 quarter 2014 | 2 quarter 2014 | 1 quarter 2014
- year 2013 | 4th quarter of 2013 | 3rd quarter of 2013 | 2nd quarter of 2013 | 1st quarter of 2013
- year 2012 | 4th quarter of 2012 | 3rd quarter of 2012 | 2nd quarter of 2012 | 1st quarter of 2012
- year 2011 | 4th quarter of 2011 | 3rd quarter of 2011 | 2nd quarter of 2011 | 1st quarter of 2011
Show all
Hide
Published: 10.10.2011
The data are valid as of the release date of the publication.
Contact: Information Services Unit - Headquarters, tel.: +420 274 056 789, email: infoservis@czso.cz


